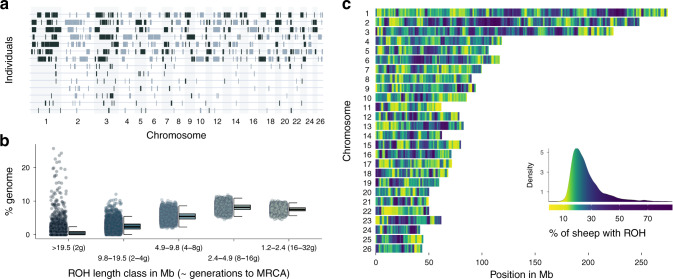
Fig. 1. Runs of homozygosity (ROH) variation among individuals and across the genome.
a ROH longer than 5 Mb in the seven individuals with the highest inbreeding coefficients FROH in the seven top rows and the seven individuals with the lowest FROH in the seven bottom rows. b Distribution of ROH among different length classes. Each data point represents the proportion of ROH of a certain length class within an individual’s autosomal genome. ROH length classes were categorised by their expected average physical length when the underlying haplotypes had a most recent common ancestor (MRCA) 2–32 generations (g) ago. c Genome-wide ROH density among all 5952 individuals in non-overlapping 500 Kb windows. The colour gradient has been scaled according to the ROH density, which is shown in the figure legend.

