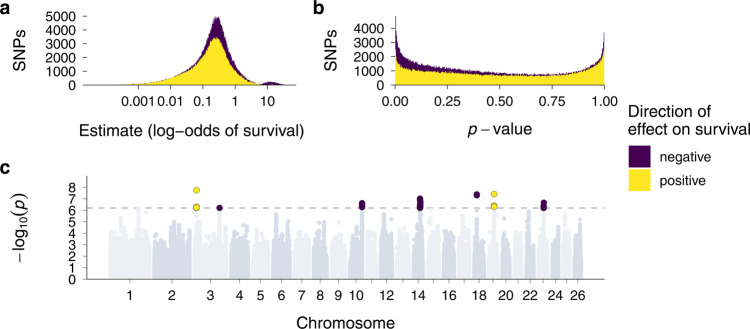
Fig. 4. GWAS of SNP-wise ROH status effects on annual survival.
Regional inbreeding depression was conceptualised and tested using two binary ROH status predictors. One of the predictors quantified the ROH status of allele A (in ROH = 1, not in ROH = 0), while the other quantified the ROH status of allele B. a Distribution of effect sizes for SNP-wise ROH status effects. b Distribution of p-values for SNP-wise ROH status effects. The yellow histograms showing positive effects are superimposed on top of the purple histograms showing negative effects to highlight a substantially larger proportion of negative ROH status effects than expected by chance. c Manhattan plot of the ROH status p-values across the genome. The dotted line marks the genome-wide significance threshold for a Bonferroni correction which was based on the effective number of tests when accounting for linkage disequilibrium.

