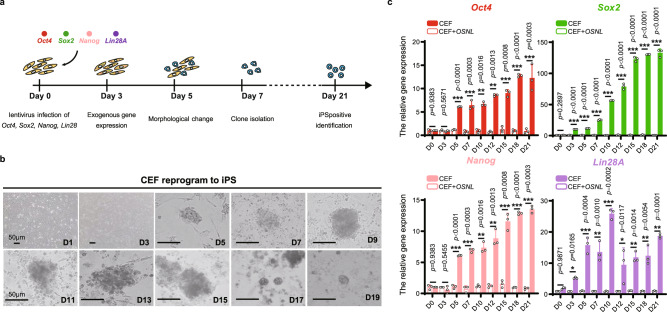
Fig. 1. CEFs can be reprogrammed to iPSCs using OSNL factors.
a Schematic diagram of a 21-day iPSC reprogramming process in vitro. The different colored dots represent the four genes of OSNL, OSNL represent Oct4, Sox2 Nanog, and Lin28A. The yellow cells represent CEF, and the blue cells represent iPS. b Morphological characterizations of CEF reprogramming to iPSCs from days 1 to 19, D means day. Scale bar: 50 μm (n = 3 independent experiments). c qRT-PCR evaluation of endogenous reprogramming gene expression from days 0 to 21. A schematic diagram of the primers designed for endogenous OSNL gene expression is shown in Supplementary Fig. 1A. CEFs were used as a negative control (data are shown as mean ± SEM, statistically analyzed by unpaired two-tailed t-test *p < 0.05, **p < 0.01, ***p < 0.001, n = 3 independent experiments).

