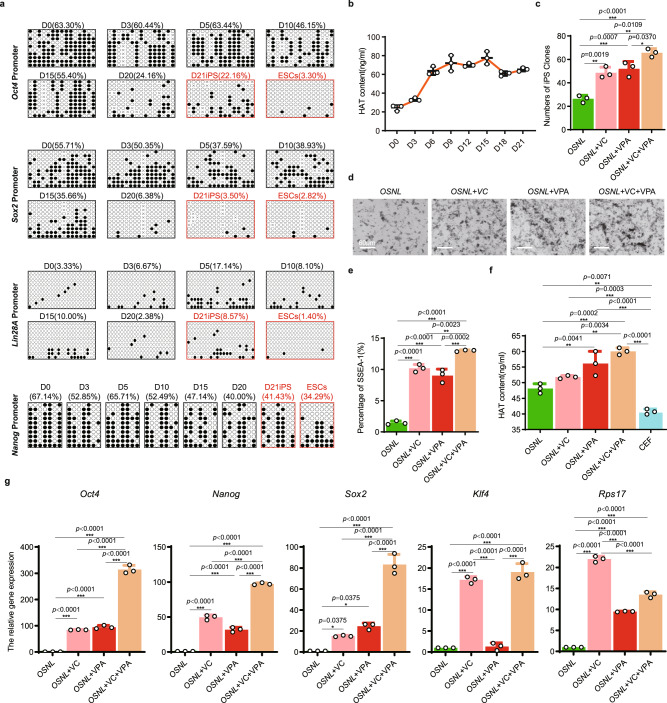
Fig. 2. Optimizing the CEF reprogramming system for chicken iPSC production.
a DNA methylation status evaluated by bisulfite sequencing of the OSNL gene promoter regions during iPSC reprogramming from day 0 to day 21, D means day. ESCs were used as the control. Black dots represent methylated sites, and white dots represent unmethylated sites, and ‘×’ represents undetected sites (n = 10 repeats). b ELISA evaluation of histone acetyltransferase (HAT) concentrations from day 0 to day 21 during iPSC formation, (n = 3 independent experiments). c Number of iPSC clones counted after adding the DNA methylase inhibitor VC and/or the histone deacetylase transferase inhibitor VPA to the reprogramming medium on day 21, VC vitamin C, VPA valproic acid. (data are shown as mean ± SEM, n = 3 independent experiments, *p < 0.05, **p < 0.01, ***p < 0.001, one-way ANOVA). d Morphological evaluation of iPSC clones on day 21, Scale bar: 60 μm, (n = 3 independent experiments). e Percentage of SSEA-1-positive cells on reprogramming day 21, (data are shown as mean ± SEM, n = 3 independent experiments, **p < 0.01, ***p < 0.001, one-way ANOVA). f Enzyme-Linked Immunosorbent Assay (ELISA) evaluation of HAT concentration to show the change in histone acetylation status after the addition of VC and/or VPA. CEFs were used as the controls, (data are shown as mean ± SEM, n = 3 independent experiments, **p < 0.01, ***p < 0.001, one-way ANOVA). g qRT-PCR evaluation of the expression of the pluripotent marker genes Nanog, Oct4, Sox2, Klf4, and Rps17. (Data are shown as mean ± SEM, n = 3 independent experiments, *p < 0.05, **p < 0.01, ***p < 0.001, one-way ANOVA).

