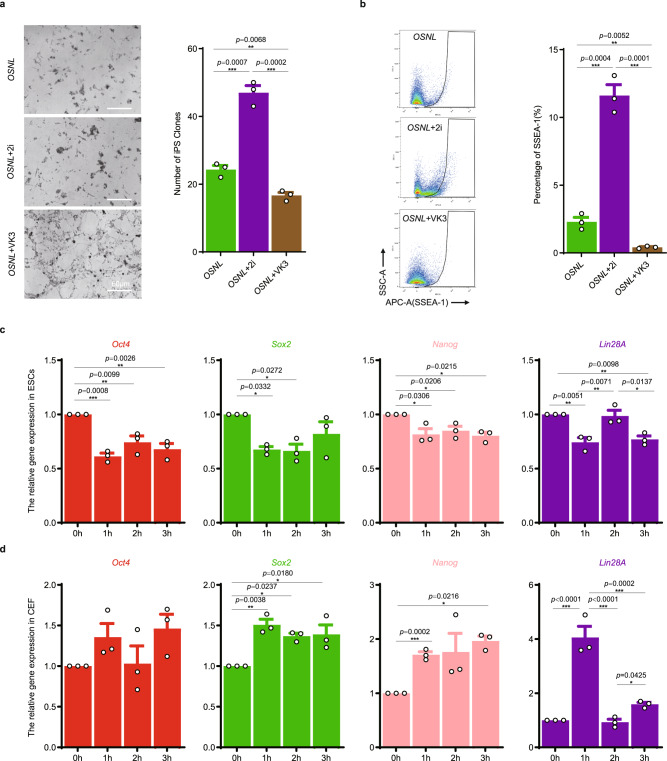
Fig. 3. Glycolytic activation facilitates chicken iPSC formation.
a Morphological evaluation and statistical analysis of iPSC clones with glycolytic activation (2i: PD0325901and SB431542) or inhibition (VK3: vitamin K3) in OSNL-induced iPSC formation. Scale bar: 60 m. (Data are shown as mean ± SEM, n = 3 independent experiments, **p < 0.01, ***p < 0.001, one-way ANOVA). b. Flow cytometric analysis of SSEA-1-positive cells in the induced cells with glycolytic activation or inhibition, (data are shown as mean ± SEM, n = 3 independent experiments, **p < 0.01, ***p < 0.001, one-way ANOVA). c, d qRT-PCR evaluation of the expression of the pluripotent genes Oct4, Sox2, Nanog, and Lin28A in ESCs (c) and CEFs (d), (data are shown as mean ± SEM, n = 3 independent experiments, *p < 0.05, **p < 0.01, ***p < 0.001, one-way ANOVA).

