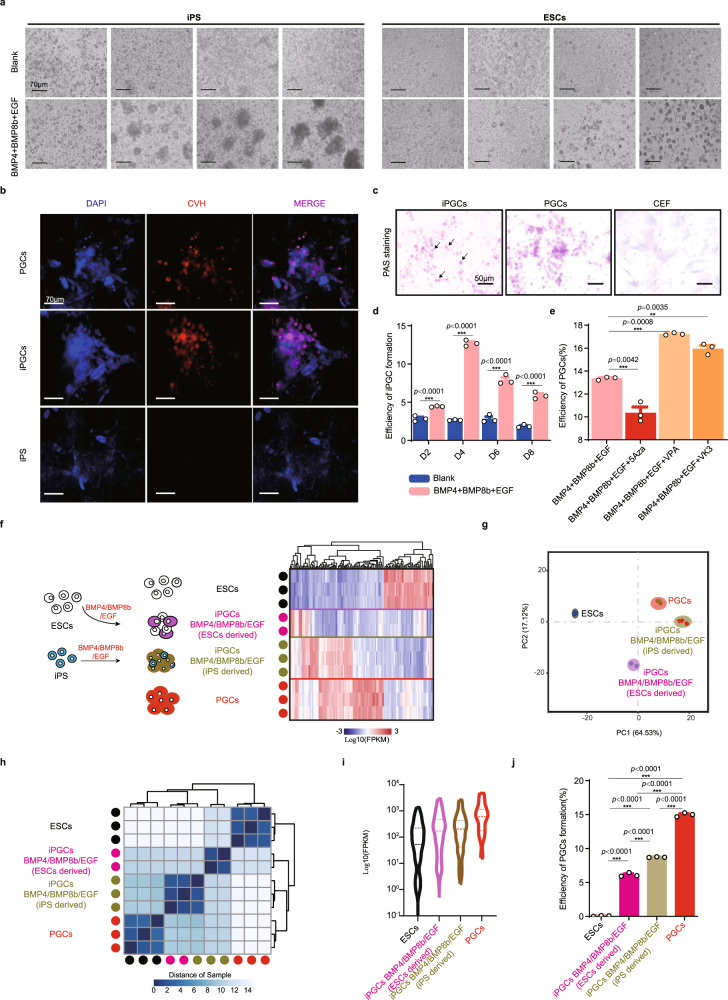
Fig. 5. Induction of iPSCs to iPGCs.
a Morphological evaluation of iPGCs induced from iPSCs with BMP4/BMP8b/EGF. ESCs were used as the control. Scale bar: 50 μm, (n = 3 independent experiments). b iPSC-derived iPGCs stained with CVH as a PGC marker. PGCs were used as a positive control, and noninduced iPSCs were used as a negative control. Scale bar: 70 μm, (n = 3 independent experiments). c Periodic acid-Schiff (PAS) staining of iPGCs, PGCs, and CEFs. The arrow shows the PAS positive iPGCs clones. Scale bar: 50 μm, (n = 3 independent experiments). d Flow cytometric analysis of the CVH-positive iPGCs induced from iPSCs. The positive cells were counted on induction days 2, 4, 6, and 8, D means day. (data are shown as mean ± SEM, n = 3 independent experiments, ***p < 0.001, unpaired two-tailed t-test). e Flow cytometric evaluation of the iPGC formation rate in conditions with glycolytic activation, histone acetylation or DNA methylation, (data are shown as mean ± SEM, n = 3 independent experiments, **p < 0.01, ***p < 0.001, unpaired two-tailed t-test). f Schematic diagram of RNA-seq analysis for iPGCs induced from iPSCs and ESCs. ESCs and PGCs were used as the controls. Unsupervised hierarchical clustering based on PGC development-related genes was applied to analyze the similarities among ESCs, ESC-derived iPGCs, iPSC-derived iPGCs, and PGCs. Heatmap shows the expression profiles of the selected genes. The color key from blue to red indicates low to high gene expression. White cells represent ESCs, red cells represent PGCs, blue cells represent iPS, cells with other colored represent iPGCs derived from different induction conditions. Dots with different colors represent independent samples from different groups for RNA-seq. g, h Principal Component Analysis (PCA) (g) and correlation analysis (h) of ESCs, ESC-derived iPGCs, iPSC-derived iPGCs, and PGCs based on the genes selected in unsupervised hierarchical clustering analysis. The color key from blue to white indicates short to long distances between samples. The colored dots represent sequencing data from individual cell samples. i Violin plot of PGC marker genes from RNA-seq data of ESCs, ESC-derived iPGCs, iPSC-derived PGCs and PGCs. The solid lines at each end of the violin diagram represent the maximum and minimum values, respectively. The three dotted lines in the middle of the violin diagram represent the 75% percentile, the mean, and the 25% percentile in turn. j ESCs, ESC-derived iPGCs, iPSC-derived iPGCs and PGCs were treated with pKH26 and injected into the recipients. The migration of the injected cells was evaluated by flow cytometric analysis of the pKH26-positive cells in isolated genital ridges. (Data are shown as mean ± SEM, n = 3 independent experiments, ***p < 0.001, one-way ANOVA).

