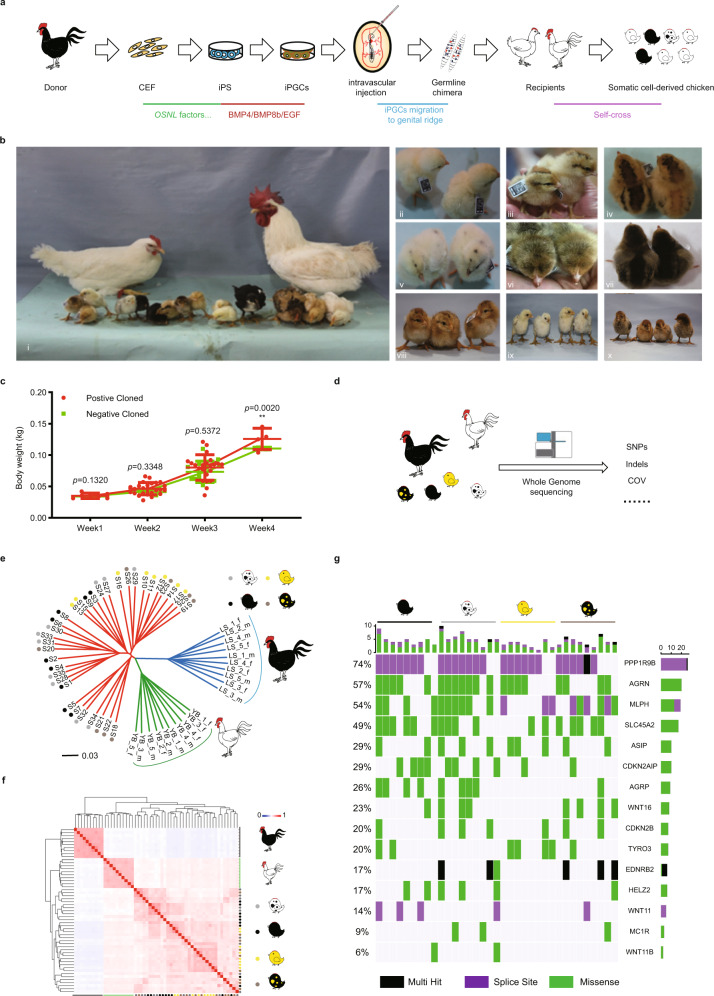
Fig. 7. Production and identification of somatic cell-derived chickens.
a Schematic diagram of viable chicken production from somatic cells. Black feathered Langshan chickens are used as donors, White Plymouth Rock chicken are used as recipients. b i: Sexually mature White Plymouth Rock chickens that received iPGC transplantation in the embryo stage, as well as their positive (n = 189) and negative offspring (n = 320), showing black feathered, white feathered, black-white feathered, yellow feathered, and black-yellow feathered chickens; ii–x: offspring with similar appearance produced by the White Plymouth Rock chickens that received iPGC transplantation in the embryo stage. c Growth rate of the chickens positive for the clones compared with the negative chickens. (Data are shown as the mean ± SD, n = 5, 24, 22, 4 chicken in week 1, 2, 3, 4 in positive group, n = 1, 3, 12, 2 in week 1, 2, 3, 4 chicken in negative group, **p < 0.01, unpaired two-tailed t-test). d Schematic diagram of whole-genome resequencing for the black feathered Langshan chicken, White Plymouth rock chicken and offspring. e Phylogenetic tree of donor black feathered Langshan chickens, recipient White Plymouth Rock chickens and offspring, Scale bar: 0.03 for genetic distance. Different colored dots represent individual sequenced samples. f Genetic similarity index (GSI) analysis of black feathered Langshan chickens, recipient White Plymouth rock chickens and offspring, the color key from blue to red indicates the similarities from low to high between samples. g Distribution of different single nucleotide polymorphism (SNP) loci in feather color-related genes in individuals with different feather color phenotypes. Horizontal axis represents for individuals. The vertical axis represents the proportion of variations. Scale bar represents the number of samples.

