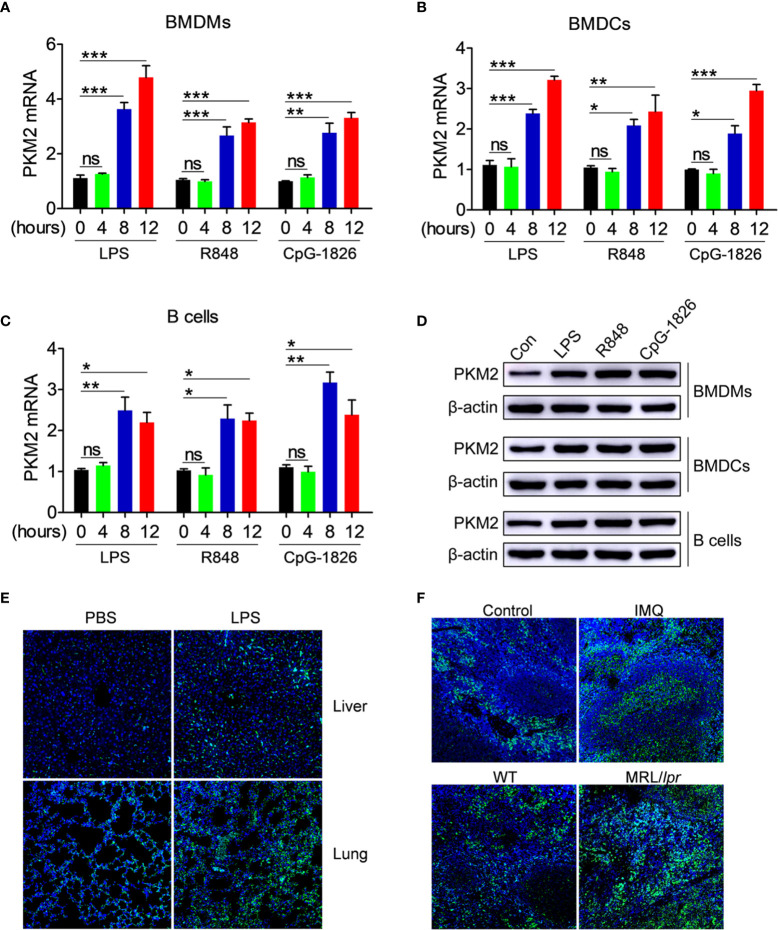
Figure 1.
PKM2 expression is induced by TLRs in vitro and in vivo. (A–D) BMDMs, BMDCs and murine splenic B cells were stimulated with LPS (100 ng/mL), R848 (1μg/mL) and CpG-1826 (1 μM) for different times. Q-PCR analysis of PKM2 expression in BMDMs (A) BMDCs (B) and murine splenic B cells (C) at 4, 8 and 12 hours. Western blot analysis of PKM2 expression in BMDMs, BMDCs and murine splenic B cells at 24 hours (D). The data shown represent the means of three independent experiments and the error bars represent the S.E.M. (E) Immunofluorescence staining to detect the expression of PKM2 in the liver and lung sections from mice challenged by LPS (10 μg/g body weight) for 12 hours. (F) Immunofluorescence staining to detect the expression of PKM2 in the spleen sections from mice treated by imiquimod for 8 weeks or lupus-prone MRL/lpr mice. Blue represents DAPI; green represents PKM2. The data are shown as the means ± SEM (n = 6 mice/group) and are representative of three independent experiments. *p < 0.05, **p < 0.01, ***p < 0.001, as determined by ANOVA tests; ns denotes p > 0.05.

