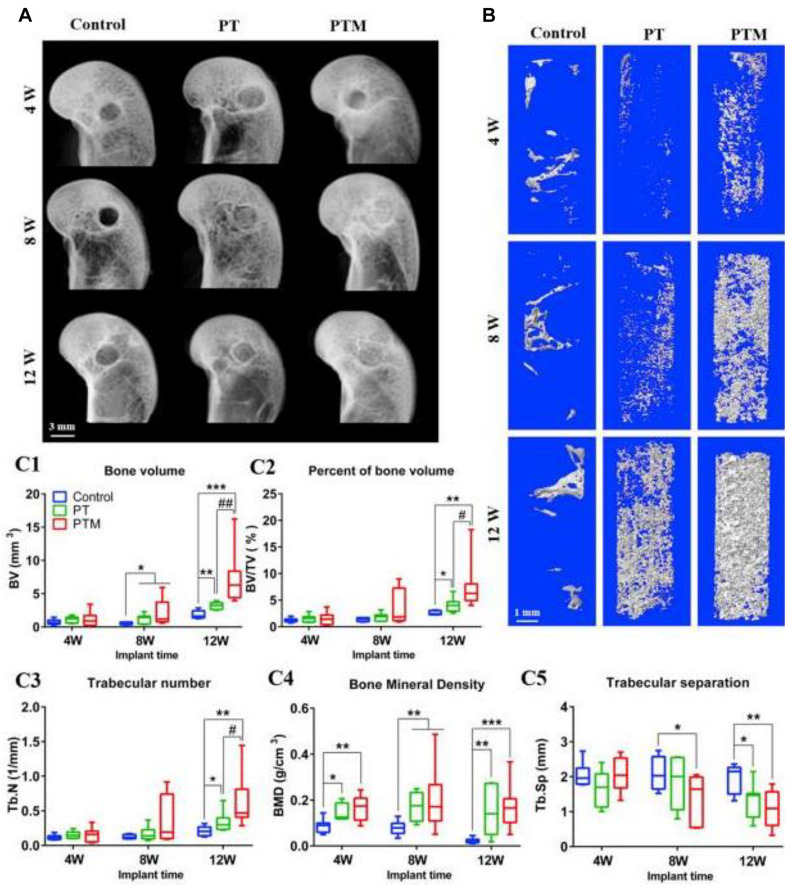
FIGURE 3.
New bone formation within bone tunnel. (A) Representative radiographs at 4, 8, and 12 weeks after surgery. (B) Representative 3D micro-CT images within a region of interest of central 2.5 mm in diameter of the bone tunnel at 4, 8, and 12 weeks after surgery. (C) Quantitative analysis of micro-CT of the new bone in the bone tunnel at 4, 8, and 12 weeks after surgery: (C1) BV; (C2) BV/TV; (C3) Tb.N; (C4) BMD; (C5) Tb. Sp. n = 8. *p < 0.05 vs. control group, **p < 0.01 vs. control group, ***p < 0.001 vs. control group, #p < 0.05 vs. PT group, ##p < 0.01 vs. PT group. Reproduced from Lai et al. (2019) with permission from Elsevier (Copyright 2019).

