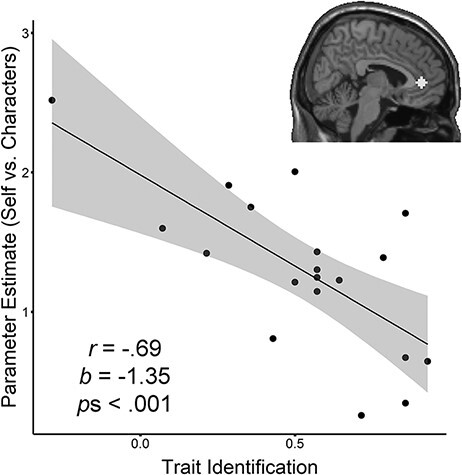
Fig. 4.

Scatterplot depicting the association between trait identification and the blood oxygen level–dependent response difference to all Self trials vs Fictional Character trials in the independently defined vMPFC ROI. Trait identification scores were recoded such that the lowest possible score on the scale was equal to −1 and the highest possible score was equal to 1. Inset shows location of ROI (6, 42, 3). Coordinates (x, y, z) are in Montreal Neurological Institute stereotaxic space.
