
Fig. 2.
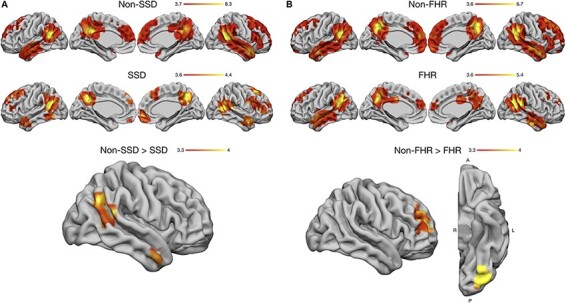
Whole-brain exploratory searchlight analysis. SSD dataset (A) and FHR dataset (B). The top panels depict the Control group (non-SSD, non-FHR), the middle panel depicts the Case group (SSD, FHR), and the bottom panel depicts the control > case comparison. No differences were observed for case > control in either dataset. All images are thresholded at a voxel-wise P < 0.001 and a cluster-wise FWE-corrected P < 0.05. Color bars depict t values. R = right, L = left, A = anterior, P = posterior.