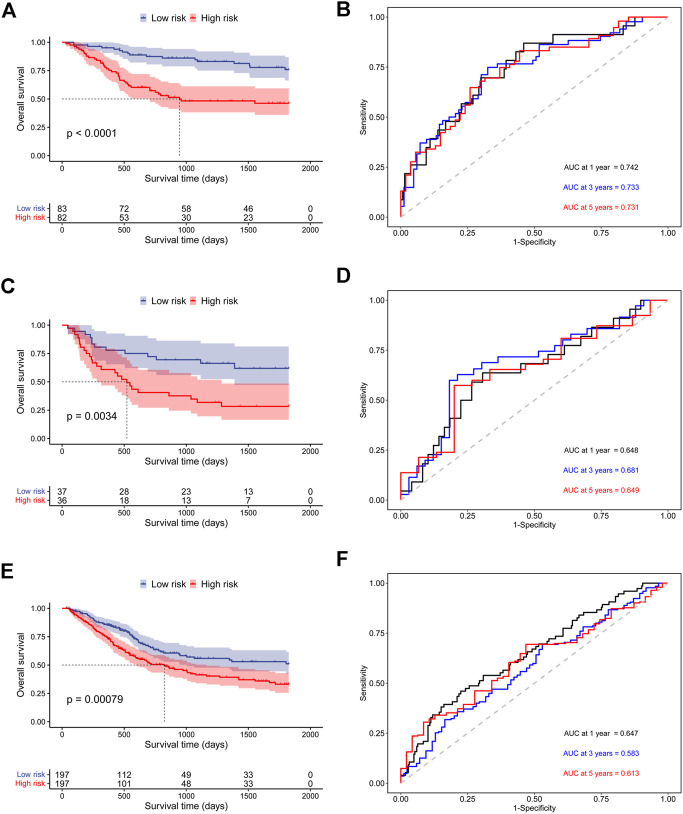
FIGURE 5.
Validation of the prognostic ability of the hypoxia-related signature for OS prediction in validation cohorts. (A) Kaplan-Meier curves for patients in GSE13507 cohort; (B) Time-dependent ROC curves for patients in GSE13507 cohort; (C) Kaplan-Meier curves for patients in GSE48075 cohort; (D) Time-dependent ROC curves for patients in GSE48075 cohort; (E) Kaplan-Meier curves for patients in TCGA-BLCA cohort; (F) Time-dependent ROC curves for patients in TCGA-BLCA cohort.

