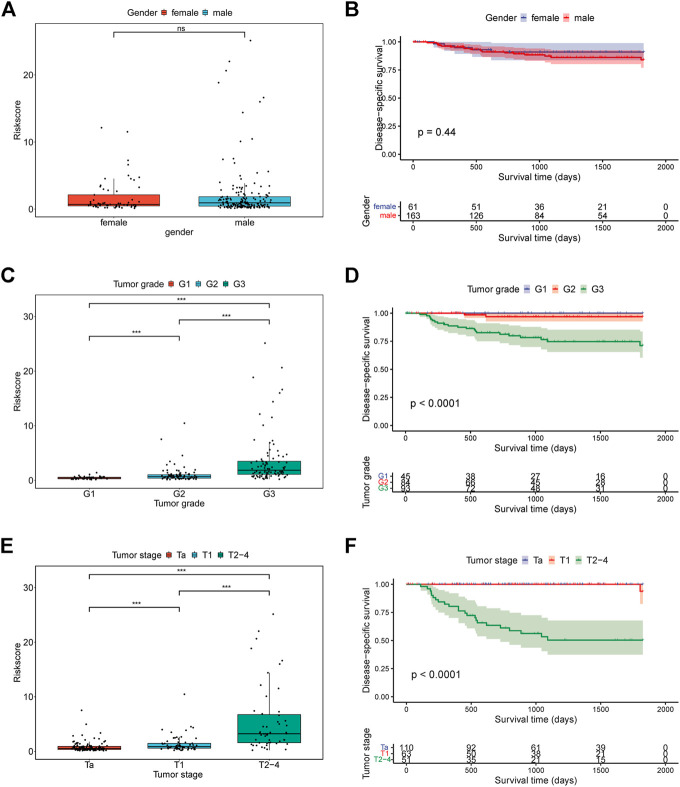
FIGURE 6.
The relationship between risk score and clinical characteristics. (A) The relationship between risk score and gender; (B) Kaplan-Meier curves for patients in GSE32894 cohort based on gender; (C) The relationship between risk score and tumor grade; (D) Kaplan-Meier curves for patients in GSE32894 cohort based on tumor grade; (E) The relationship between risk score and tumor stage; (F) Kaplan-Meier curves for patients in GSE32894 cohort based on tumor stage.

