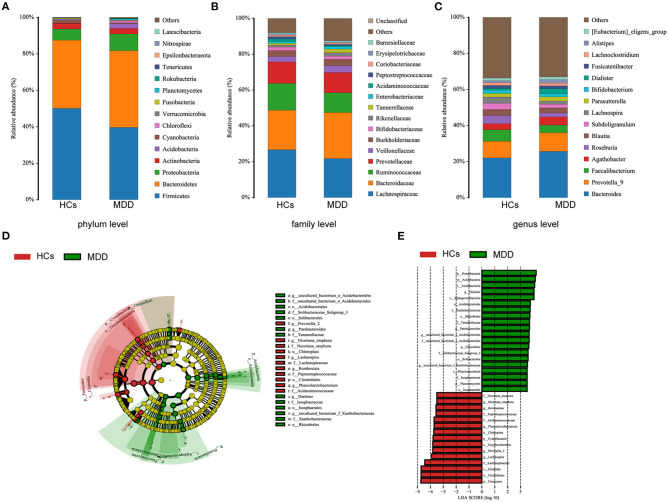
Figure 3.
Taxonomic differences in fecal microbiota between HCs and MDD patients. Comparison of relative abundance at the bacterial phylum (A), family (B) and genus (C) levels between HCs and MDD patients. LEfSe identified the most differentially abundant taxa between HCs and MDD patients. The brightness of each dot is proportional to its effect size (D). Taxa enriched in HCs are indicated with a negative logarithmic discriminant analysis (LDA) score (red), and taxa enriched in MDD patients have a positive score (green). Only taxa meeting an LDA significance threshold > 3.5 are shown (E).

