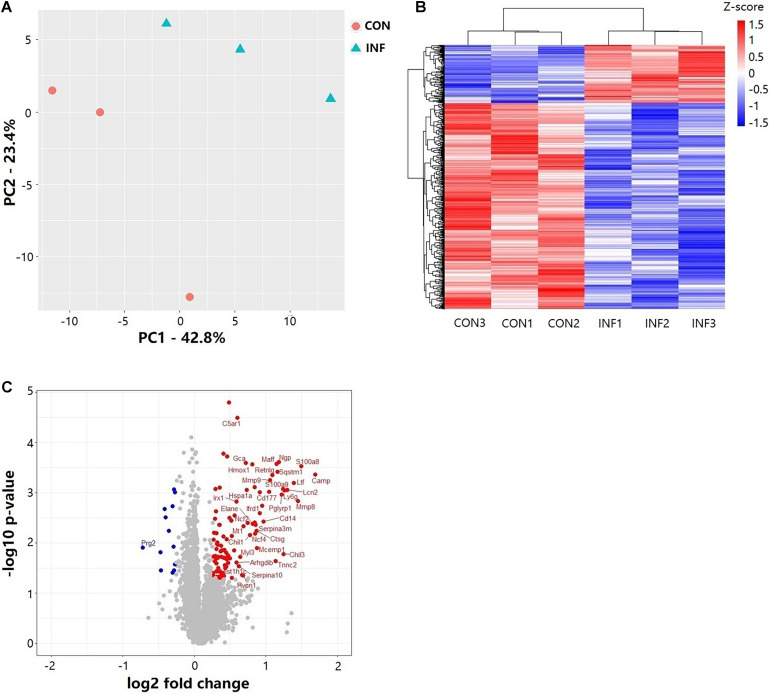
FIGURE 3.
Results of TMT label quantitative proteome analysis of mice lungs. (A) PCA score plots of the first two principal components of proteomic expression levels in mice lungs of CON and INF groups. Each group has 3 biological replicates, each replicate composes of three different mice. (B) Hierarchical clustering of proteins with Student’s t-test with nominal p ≤ 0.05. (C) Volcano plot showing the differential proteins up and down regulated in INF group. Student’s t-test nominal p ≤ 0.05 and a ratio of means ≥ 1.2 or ≤ 0.83 are applied as significance thresholds. Differentially expressed proteins are highlighted in red (up-regulated) or blue (down-regulated). The gene names are given for the proteins whose ratio ≥ 1.5 or ≤ 0.67.

