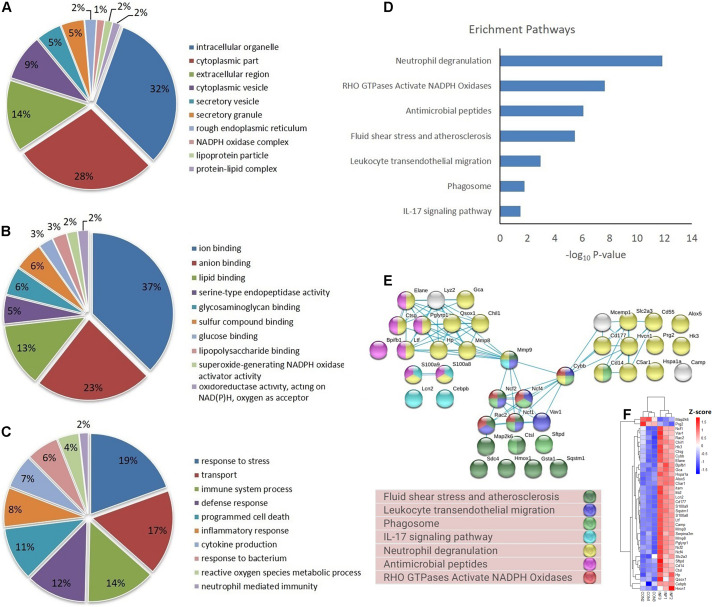
FIGURE 4.
GO, enrichment pathways and protein-protein interactions of DEPs. (A) Cellular component (GO analysis); (B) molecular function (GO analysis); (C) biological process (GO analysis); (D) pathways (KEGG and REACTOME); (E) protein-protein interaction using STRING database; (F) expression of proteins involved in key pathways.

