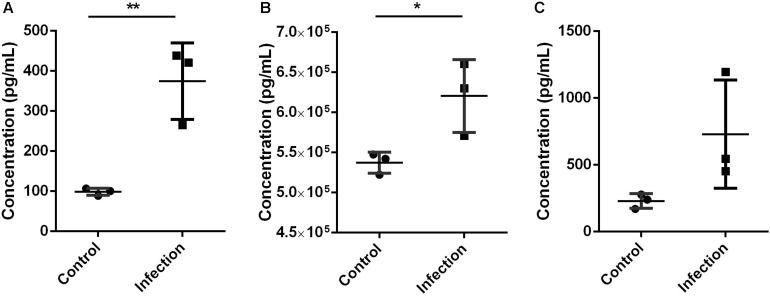
FIGURE 5.
Expression level of Mmp9 (A), S100a8/a9 (B), and IL-6 (C) in mice lung tissue 6 h after inoculated with A. baumannii by Elisa. MMP9 and S100a8/a9 showed the same expression pattern with proteomics analysis. Values represent the means ± SD of three replicates. Shapiro-Wilk test was performed on the Elisa data that showed the data followed a normal distribution (p > 0.05), so t-test was employed to compare the Elisa data between the two groups. Student’s t-test, *p < 0.05; **p < 0.01.

