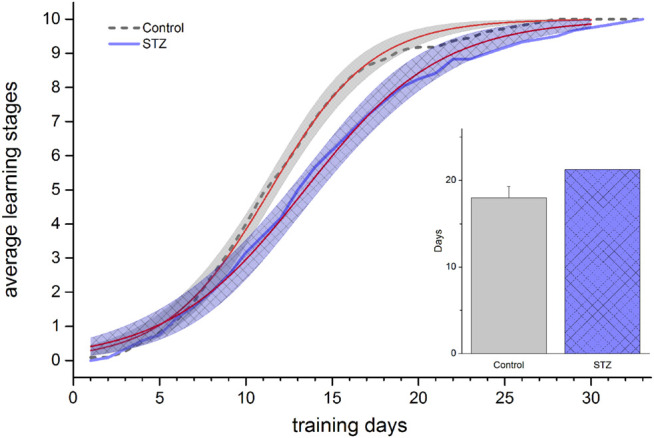
FIGURE 7.

Learning performance in the 5 Choice Serial Reaction Time task in EXP2. Learning curves of control and STZ-treated animals are depicted. Shaded areas show the 95% confidence band of the fitted sigmoidal regression curves (thin [red] lines). The regression lines significantly differ (no overlap between the confidence bands). The column chart inset shows the number of days taken to reach the final stage. Means ± SEM values are shown. No significant difference was detected between the two groups (unpaired t-test: t(21) = −1.46, ns).
