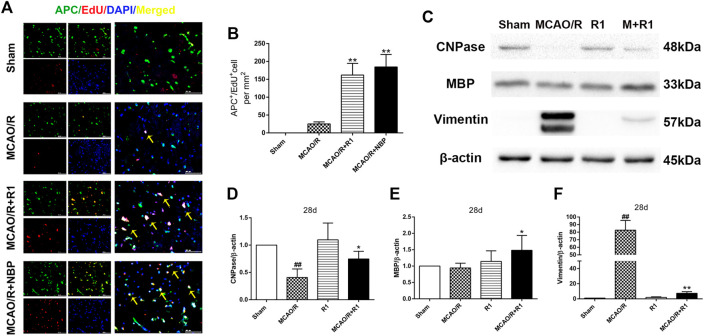
FIGURE 5.
R1 facilitates oligodendrogenesis and preserves myelin after ischemic stroke (A) Representative images of the infarction area costained with antibodies against APC+ (green, marker of oligodendrocytes) and EdU (red, marker of proliferating cells) on day 28 after R1 treatment, yellow arrows indicate proliferated oligodendrocytes (EdU+/APC+ cells), DAPI (blue) indicates the nucleus, Scale bar = 50 μm (B) Quantitative analysis of proliferating oligodendrocytes (EdU+/APC+ cells) in the cortex region after R1 treatment. n = 3 brains per group. Representative images of immunoblotting (C) and quantification of cnpase (cyclicnucleotide 30-phosphohydrolase, D), MBP (myelin basic protein, E), and vimentin (F) in the infarct cortex region of the Sham, MCAO/R, R1, and MCAO/R + R1 groups on day 28 after MCAO surgery. n = 3 in each group. Data are expressed as the mean ± SD and were analyzed by ANOVA. # p< 0.05, ## p< 0.01 vs. Sham group; * p< 0.05, **p< 0.01 vs. MCAO/R group.

