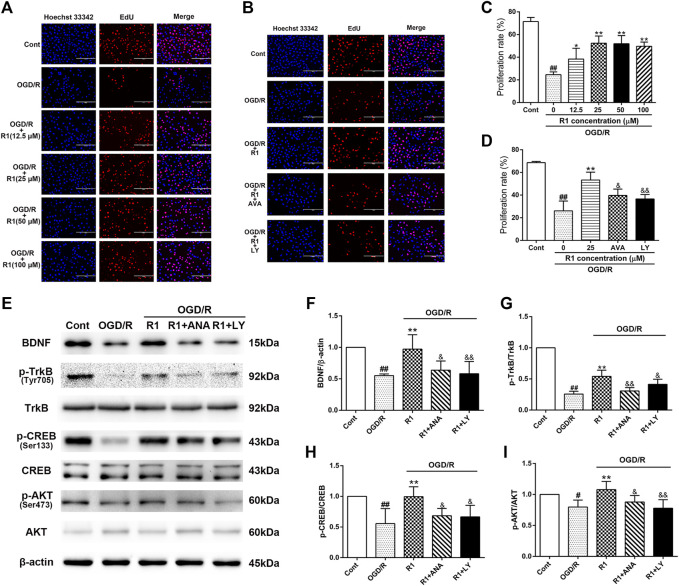
FIGURE 8.
R1 promotes neuronal proliferation though the BDNF and PI3K signaling pathways in vitro (A) R1 promotes neuronal proliferation. PC-12 cells were treated with or without R1 (drug concentration reached up to 100 µM) for 12 h. Images of proliferating neurons detected by EdU staining. Nuclei were visualized by DAPI staining (blue). Scale bar = 200 μm (B) PC-12 cells were pretreated with or without R1 (25 µM) in the presence or absence of ANA-12 (10 μM) or LY294002 (10 μM) for 12 h. Images of proliferating neurons detected by EdU staining. Nuclei were visualized by DAPI staining (blue). Scale bar = 200 μm (C, D) Proliferation rate of EdU+ cells was analyzed. Representative images of immunoblotting (E) and quantification of the relative protein levels of BDNF (F), p-TrkB/TrkB (G), p-CREB/CREB (H) and p-Akt/Akt (I) in PC-12 cells. n = 3 in each group. Data are expressed as the mean ± SD and were analyzed by ANOVA. # p< 0.05, ## p< 0.01 vs. Cont group; * p< 0.05, **p< 0.01 vs. OGD/R group; and p< 0.05, and p< 0.01 vs. R1 group.

