FIGURE 3.
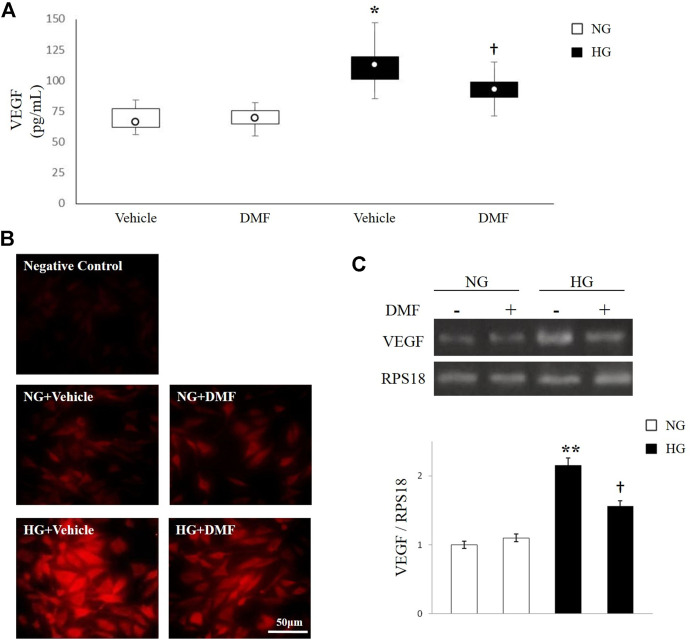
Effects of DMF on VEGF levels. ARPE-19 cells exposed to normal glucose (NG) or high glucose (HG) w/or w/o DMF (10 μM) for 24 h. (A) VEGF production was measured through ELISA. *p < 0.05 vs. Vehicle/NG; †p < 0.05 vs. Vehicle/HG; n = 6. (B) Representative photomicrographs showing VEGF expression (red). Photomicrographs are representative results of fields taken randomly from each slide and observed by Axiovert 40 epifluorescence microscope (magnification ×40). (C) Semi-quantitative RT-PCR shows VEGF mRNA expression normalized to the ribosomal protein S18 (RPS18, housekeeping gene). **p < 0.01 vs. NG untreated cells, †p < 0.05 vs. untreated/HG; n = 6.

