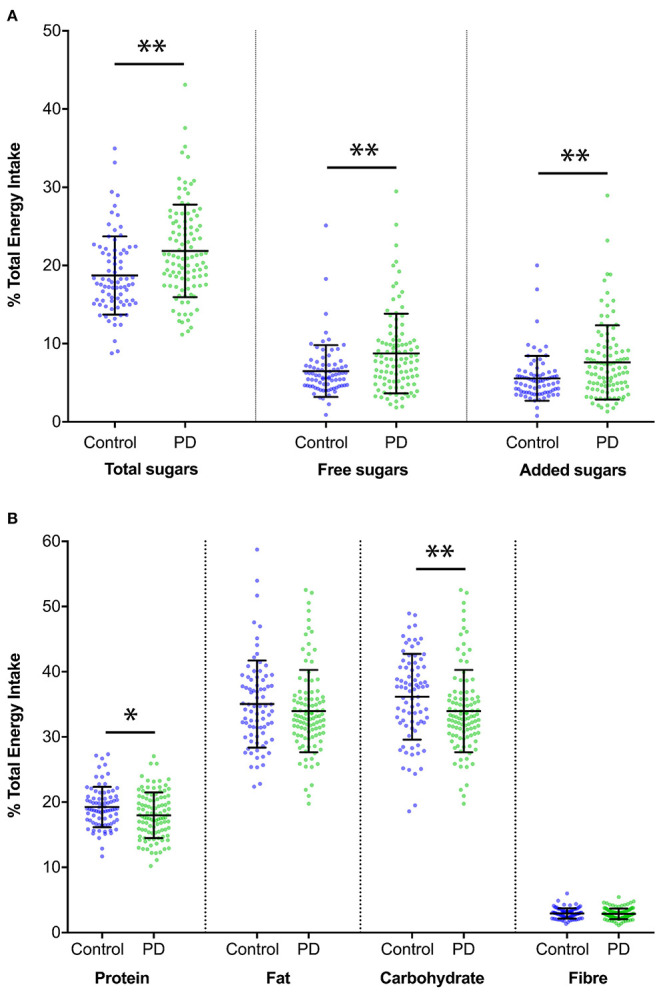
Figure 1.

Comparison of macronutrient intake as a percentage of total energy intake. (A) Comparison of sugar intake expressed as a percentage of total energy intake between Parkinson's disease and healthy control groups (Mean ± [SD]). Patients with Parkinson's disease consumed a greater amount of total sugars (percentage of total energy intake; 21.9% [5.9] in Parkinson's disease patients vs. 18.7% [5.0] in healthy controls, p < 0.001). Similar findings were also noted for free sugars (8.8% [5.1] vs. 6.5% [3.3], p = 0.001) and added sugars (7.6% [4.7] vs. 5.6% [2.9], p = 0.001). Statistically significant comparisons of p ≤ 0.001 are indicated with**. (B) Comparison of protein, fat, carbohydrate and fibre intake for Parkinson's disease and Healthy control groups, expressed as a percentage of total energy intake (Mean ± [SD]). Statistically significant comparisons of p ≤ 0.05 are indicated with*.
