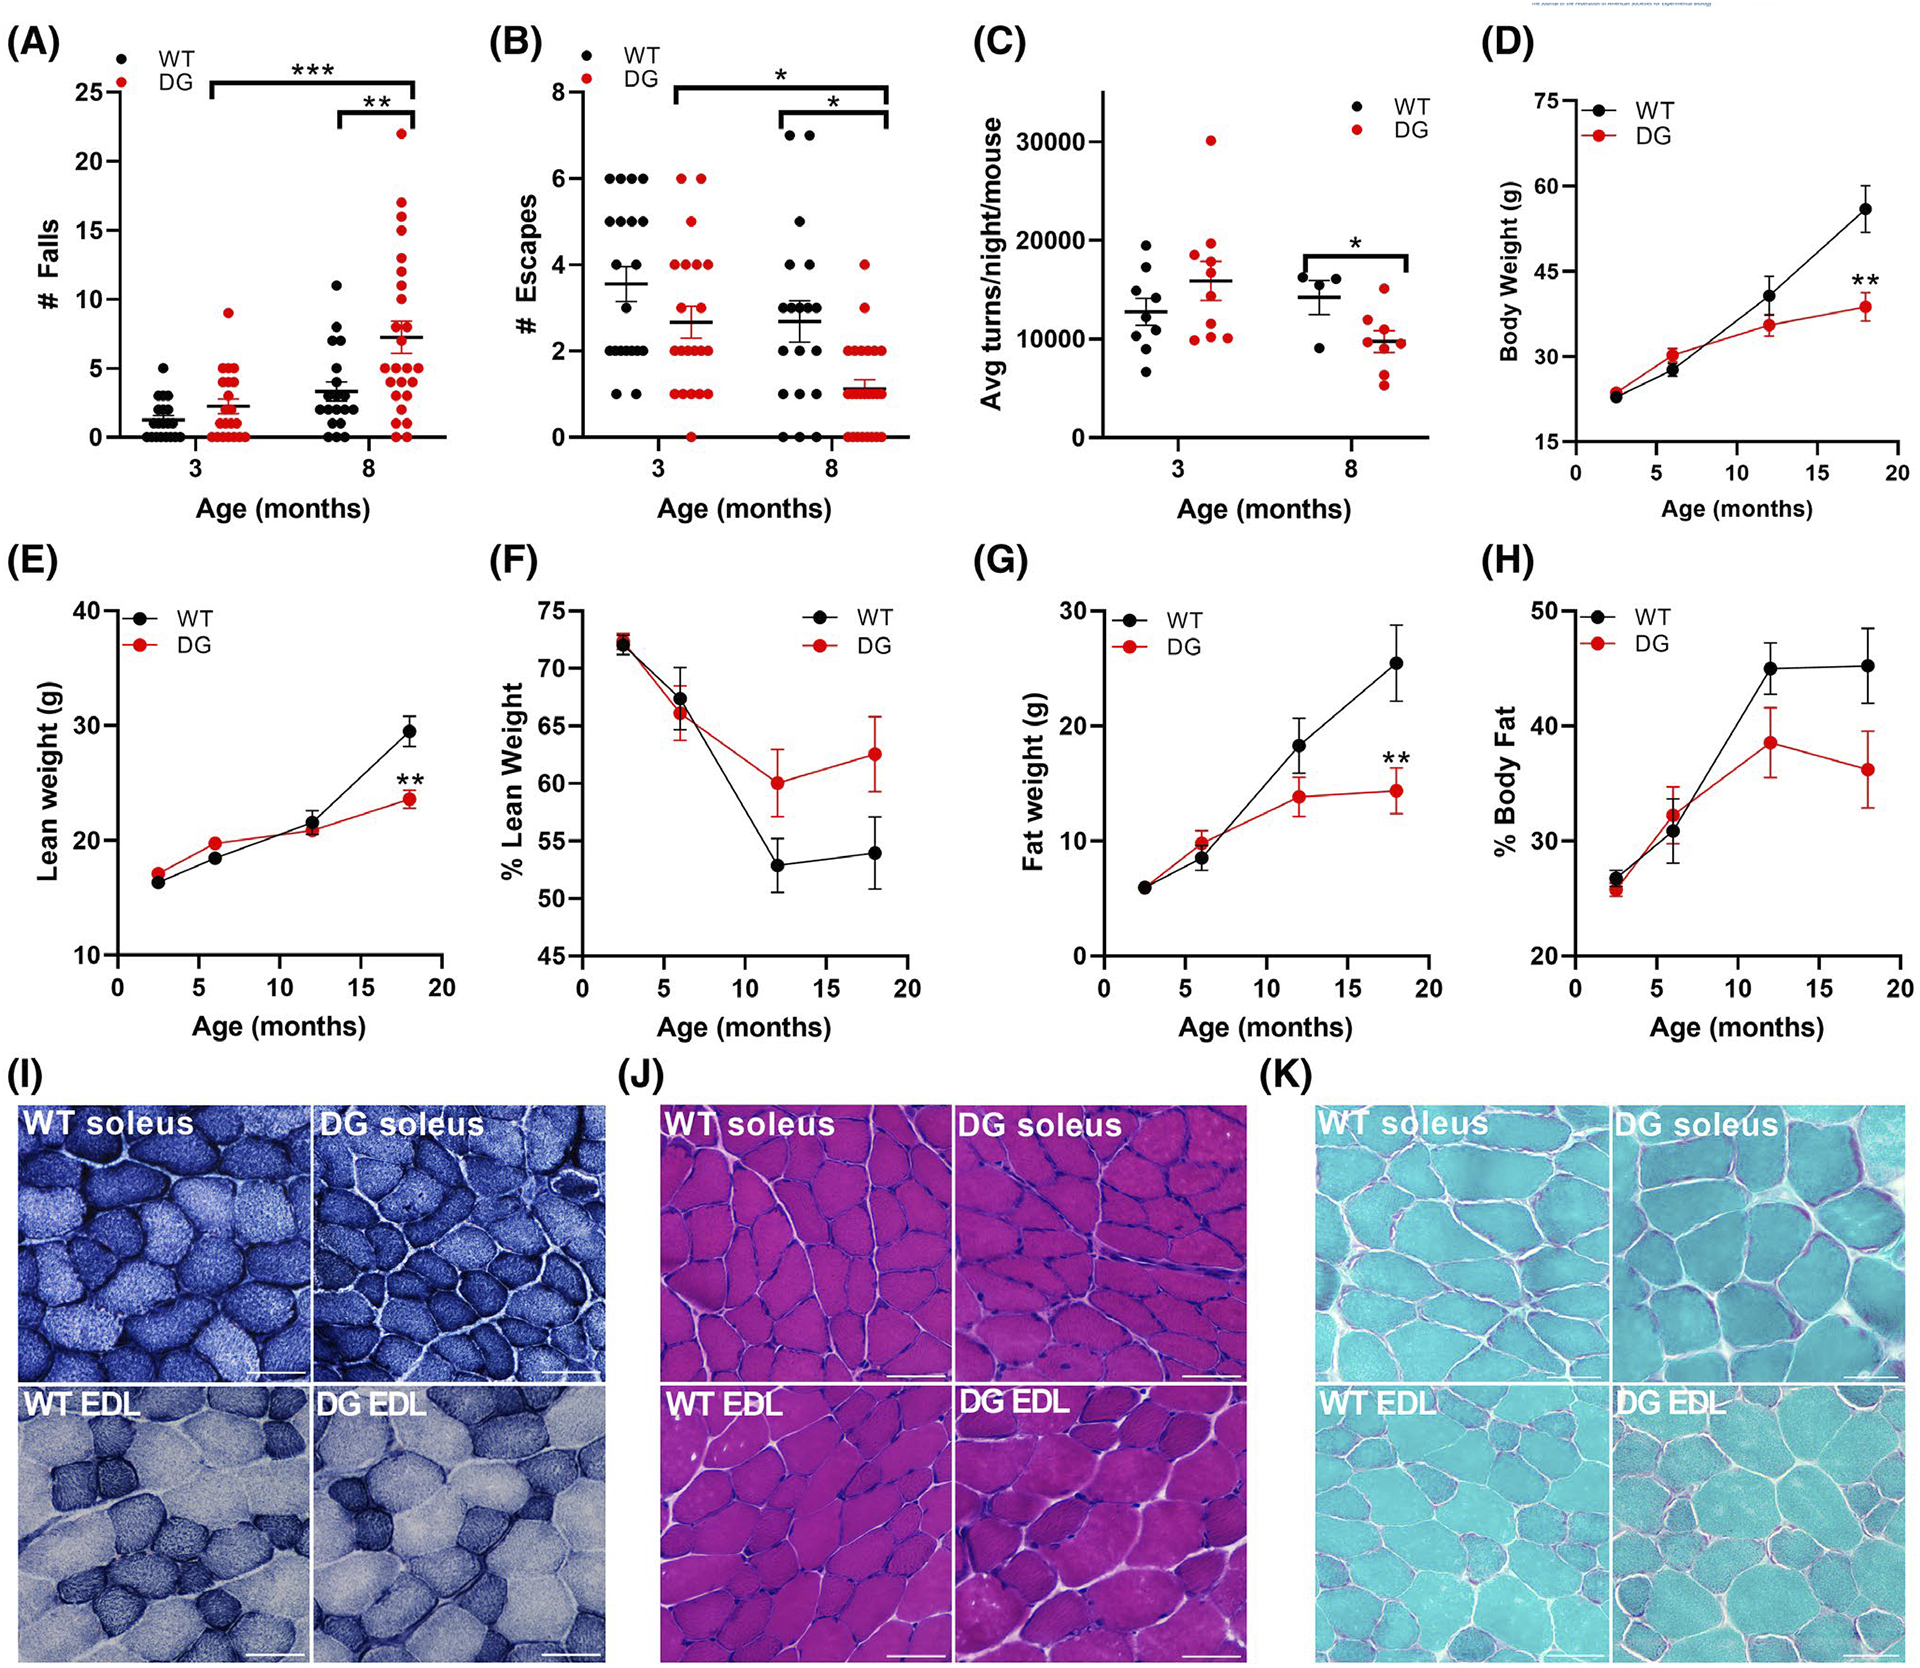
FIGURE 1.

Performance, body composition and histology in WT and DG mice. A,B, Wire-hang test of 3- and 8-month-old WT and DG mice. Number of falls (A) and escapes (B) of mice in 3-minute hang tests. C, Average nightly wheel turns per mouse. D–H, Body composition changes including total body weight (D), lean weight (E), % lean weight (F), fat weight (G), and % body fat (H) between 3 and 18 months of age in WT (n = 44) and DG (n = 52) mice. Error bars in A–H indicate the mean ± SEM. I–K, Histological changes in soleus and EDL sections from 8-month-old mice including (I) NADH-TR (J) H&E and (K) Gomori trichrome. Scale bar is 50 μm. Statistical significance is indicated by *(P < .05), **(P < .005) and ***(P < .001)
