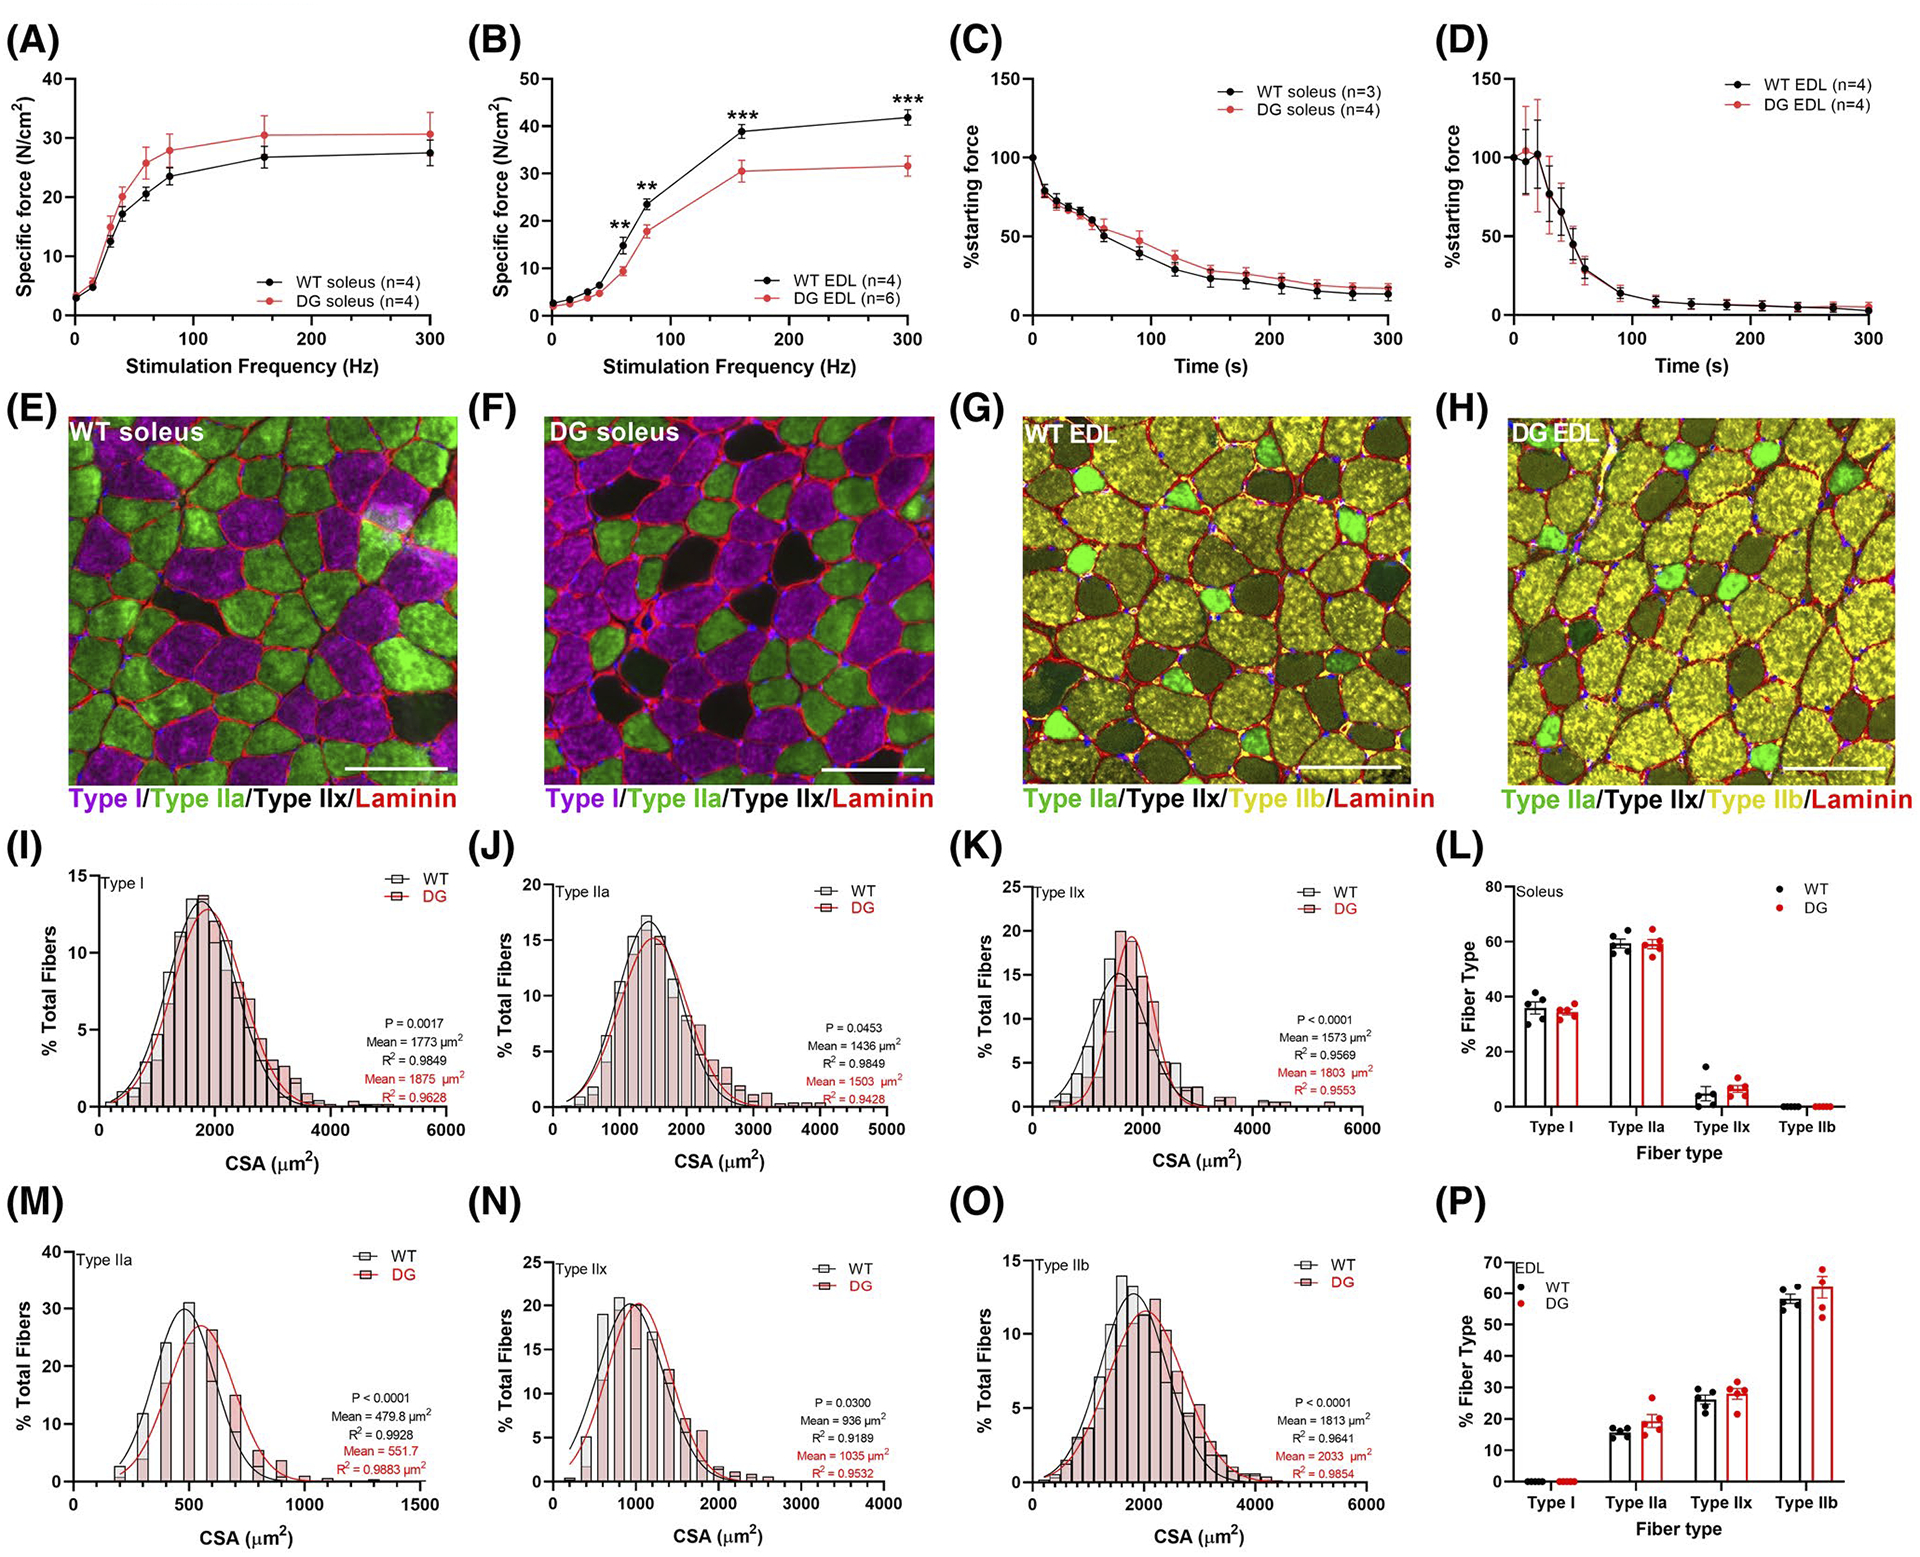
FIGURE 2.

Ex vivo muscle function, muscle fiber typing and CSA in 8-month-old male mice. Muscle force was measured at a range of stimulation frequencies in (A) soleus and (B) EDL muscles. Muscle force was then assessed with repeated stimulation in (C) soleus (1 × 30 Hz train/s) and (D) EDL (1 × 60 Hz train/s) over 5 minutes. Each symbol represents a muscle from one mouse (number of mice indicated in figure legend). E–H, Representative immunofluorescence images of soleus and EDL sections from WT and DG mice. Distribution of CSA measured in (I) Type I (WT n = 888 fibers, DG n = 1011 fibers), (J) Type IIa (WT n = 1457, DG n = 1495) and (K) Type IIx (WT n = 261, DG n = 175) muscle fibers in soleus muscles from five pairs of mice. L, Fiber type distribution in soleus muscles. Distribution of CSA in (M) Type IIa (WT n = 447, DG n = 448), (N) Type IIx (WT n = 740, DG n = 681) and (O) Type IIb (WT n = 1670, DG n = 1518) muscle fibers in EDL muscles from five pairs of mice. P, Fiber type distribution in EDL muscles. Scale bars are 100 μm. Data are presented as the mean ± SEM. Symbols in (L) and (P) represent a single mouse. Statistical significance is indicated by *(P < .05), **(P < .005), and ***(P < .001)
