FIGURE 3.

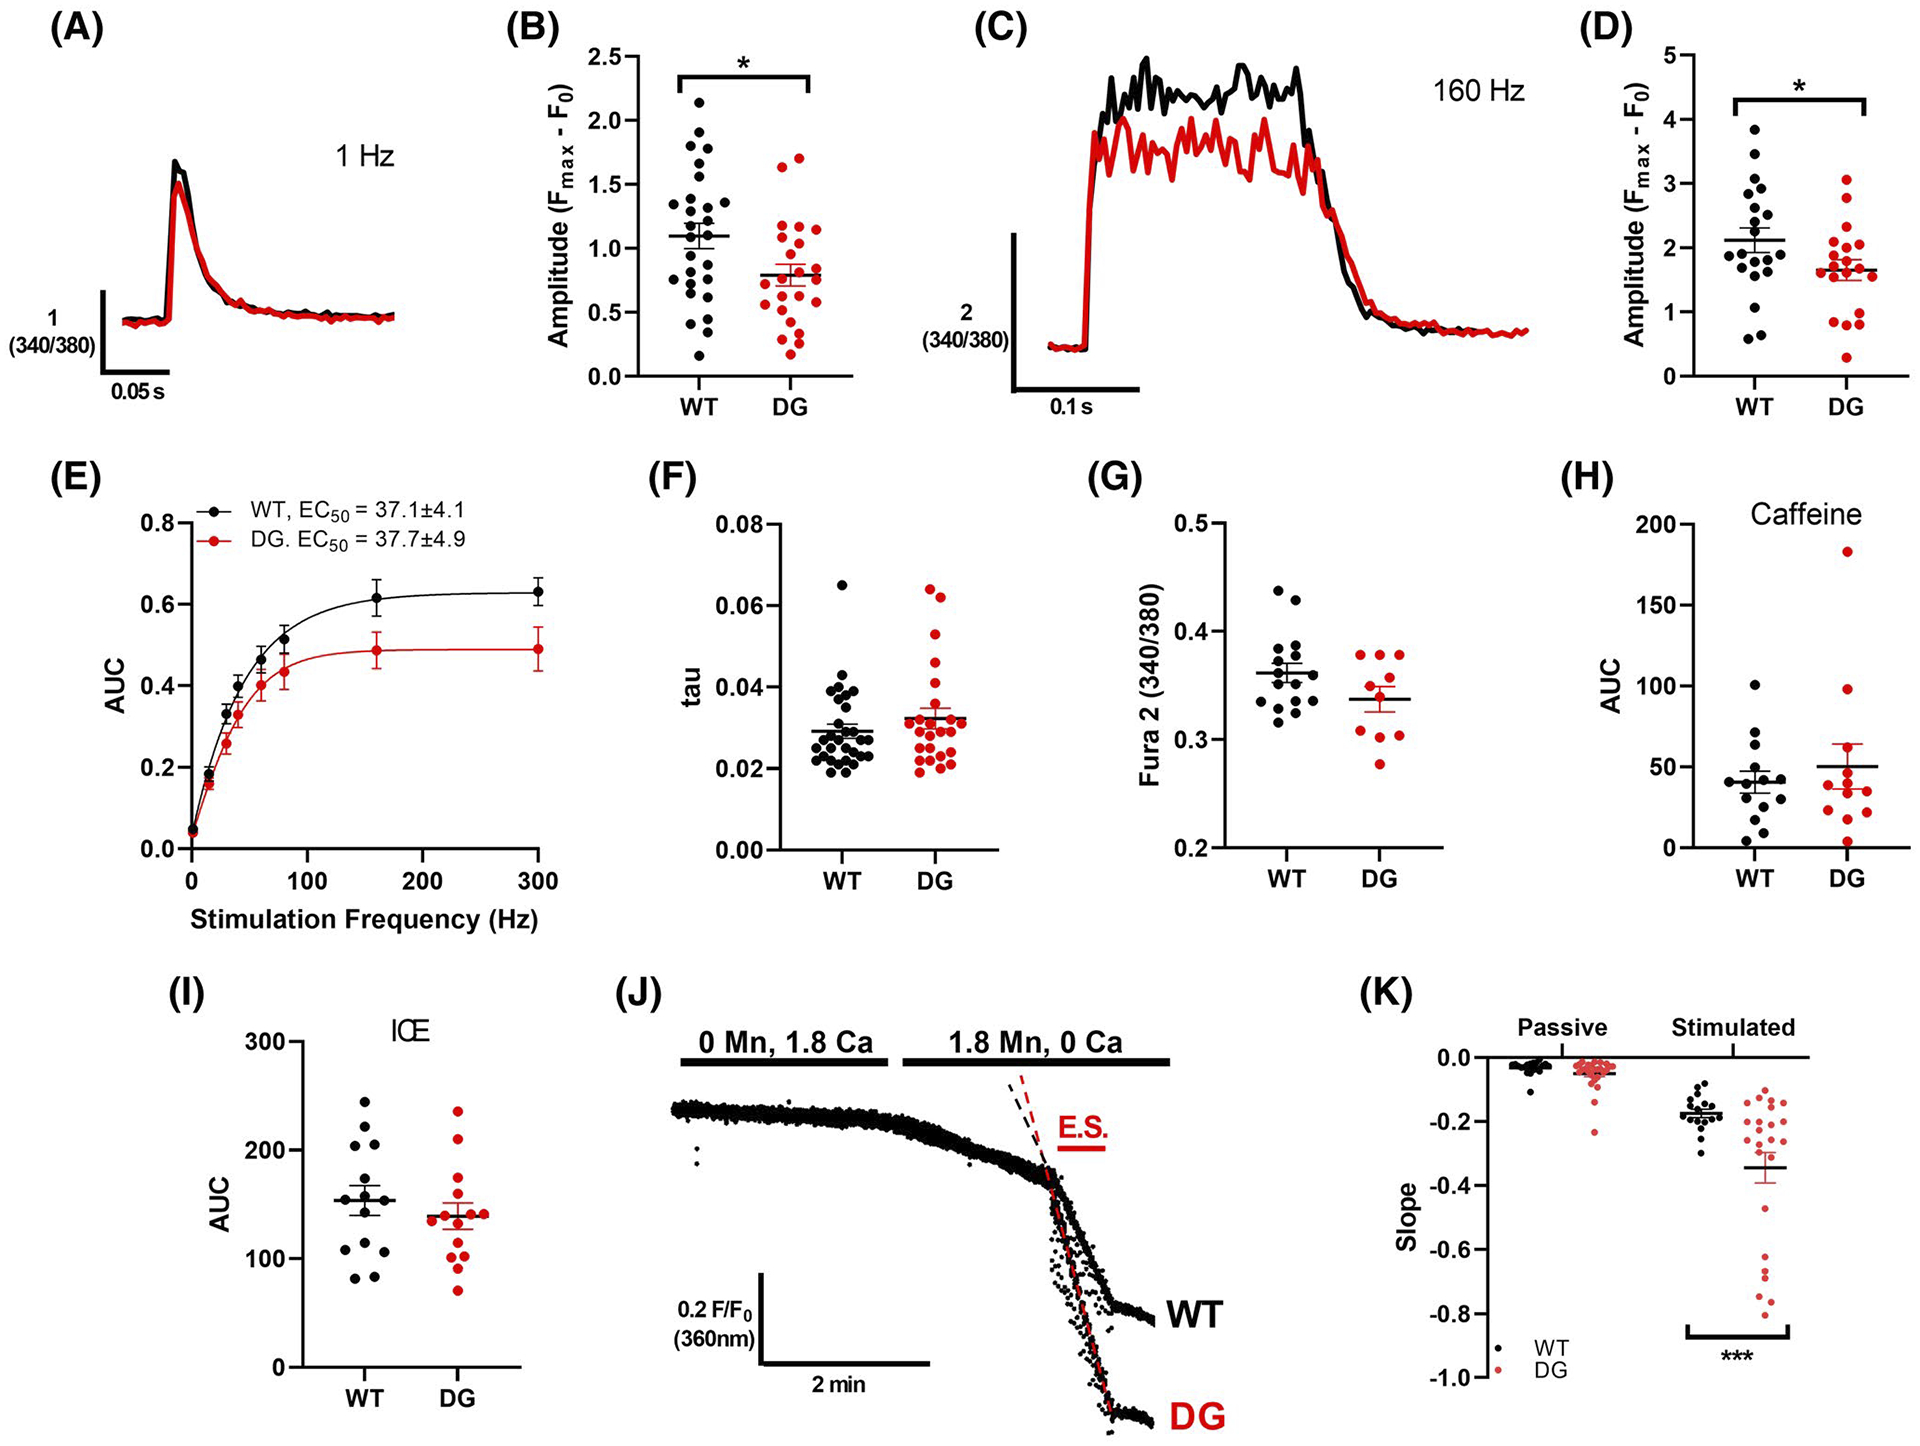
Ca2+ handling in intact FDB fibers. A, Representative Ca2+ transients from Fura-2 loaded WT (black) and DG (red) FDB fibers with 1 Hz stimulation. B, Average amplitude of release with 1 Hz stimulation. C, Representative Ca2+ transients from Fura-2 loaded WT (black) and DG (red) FDB fibers with 160 Hz stimulation. D, Average amplitude of release with 160 Hz stimulation. E, AUC of Ca2+ transients elicited by 300 ms trains at a range of stimulation frequencies in Fura-2 loaded FDB fibers were used to assess the frequency dependence of Ca2+ release. F, Average decay constant (tau) of Ca2+ transient with 1 Hz stimulation. G, Average cytoplasmic Ca2+ levels. SR Ca2+ stores were examined by measuring the area under the curve of Ca2+ release induced with (H) 30 mM caffeine in 0 Ca2+ or (I) 10 μM ionomycin, 30 μM CPA and 100 μM EGTA (ICE) in 0 Ca2+. J, Representative Fura 2 fluorescence in WT and DG fibers during a Mn2+ quench experiment. Influx was measured during the period where fibers were exposed to 1.8 mM Mn and 0 Ca in the absence (passive) or presence (stimulated) or electrical stimulation (E.S.) K, Average slope of decay during passive and stimulated influx are compared in WT and DG fibers. Each symbol indicates a fiber, and fibers were obtained from three to four mice per group. Error bars indicate the mean ± SEM. Statistical significance is indicated by *(P < .05), **(P < .005) and ***(P < .001)
