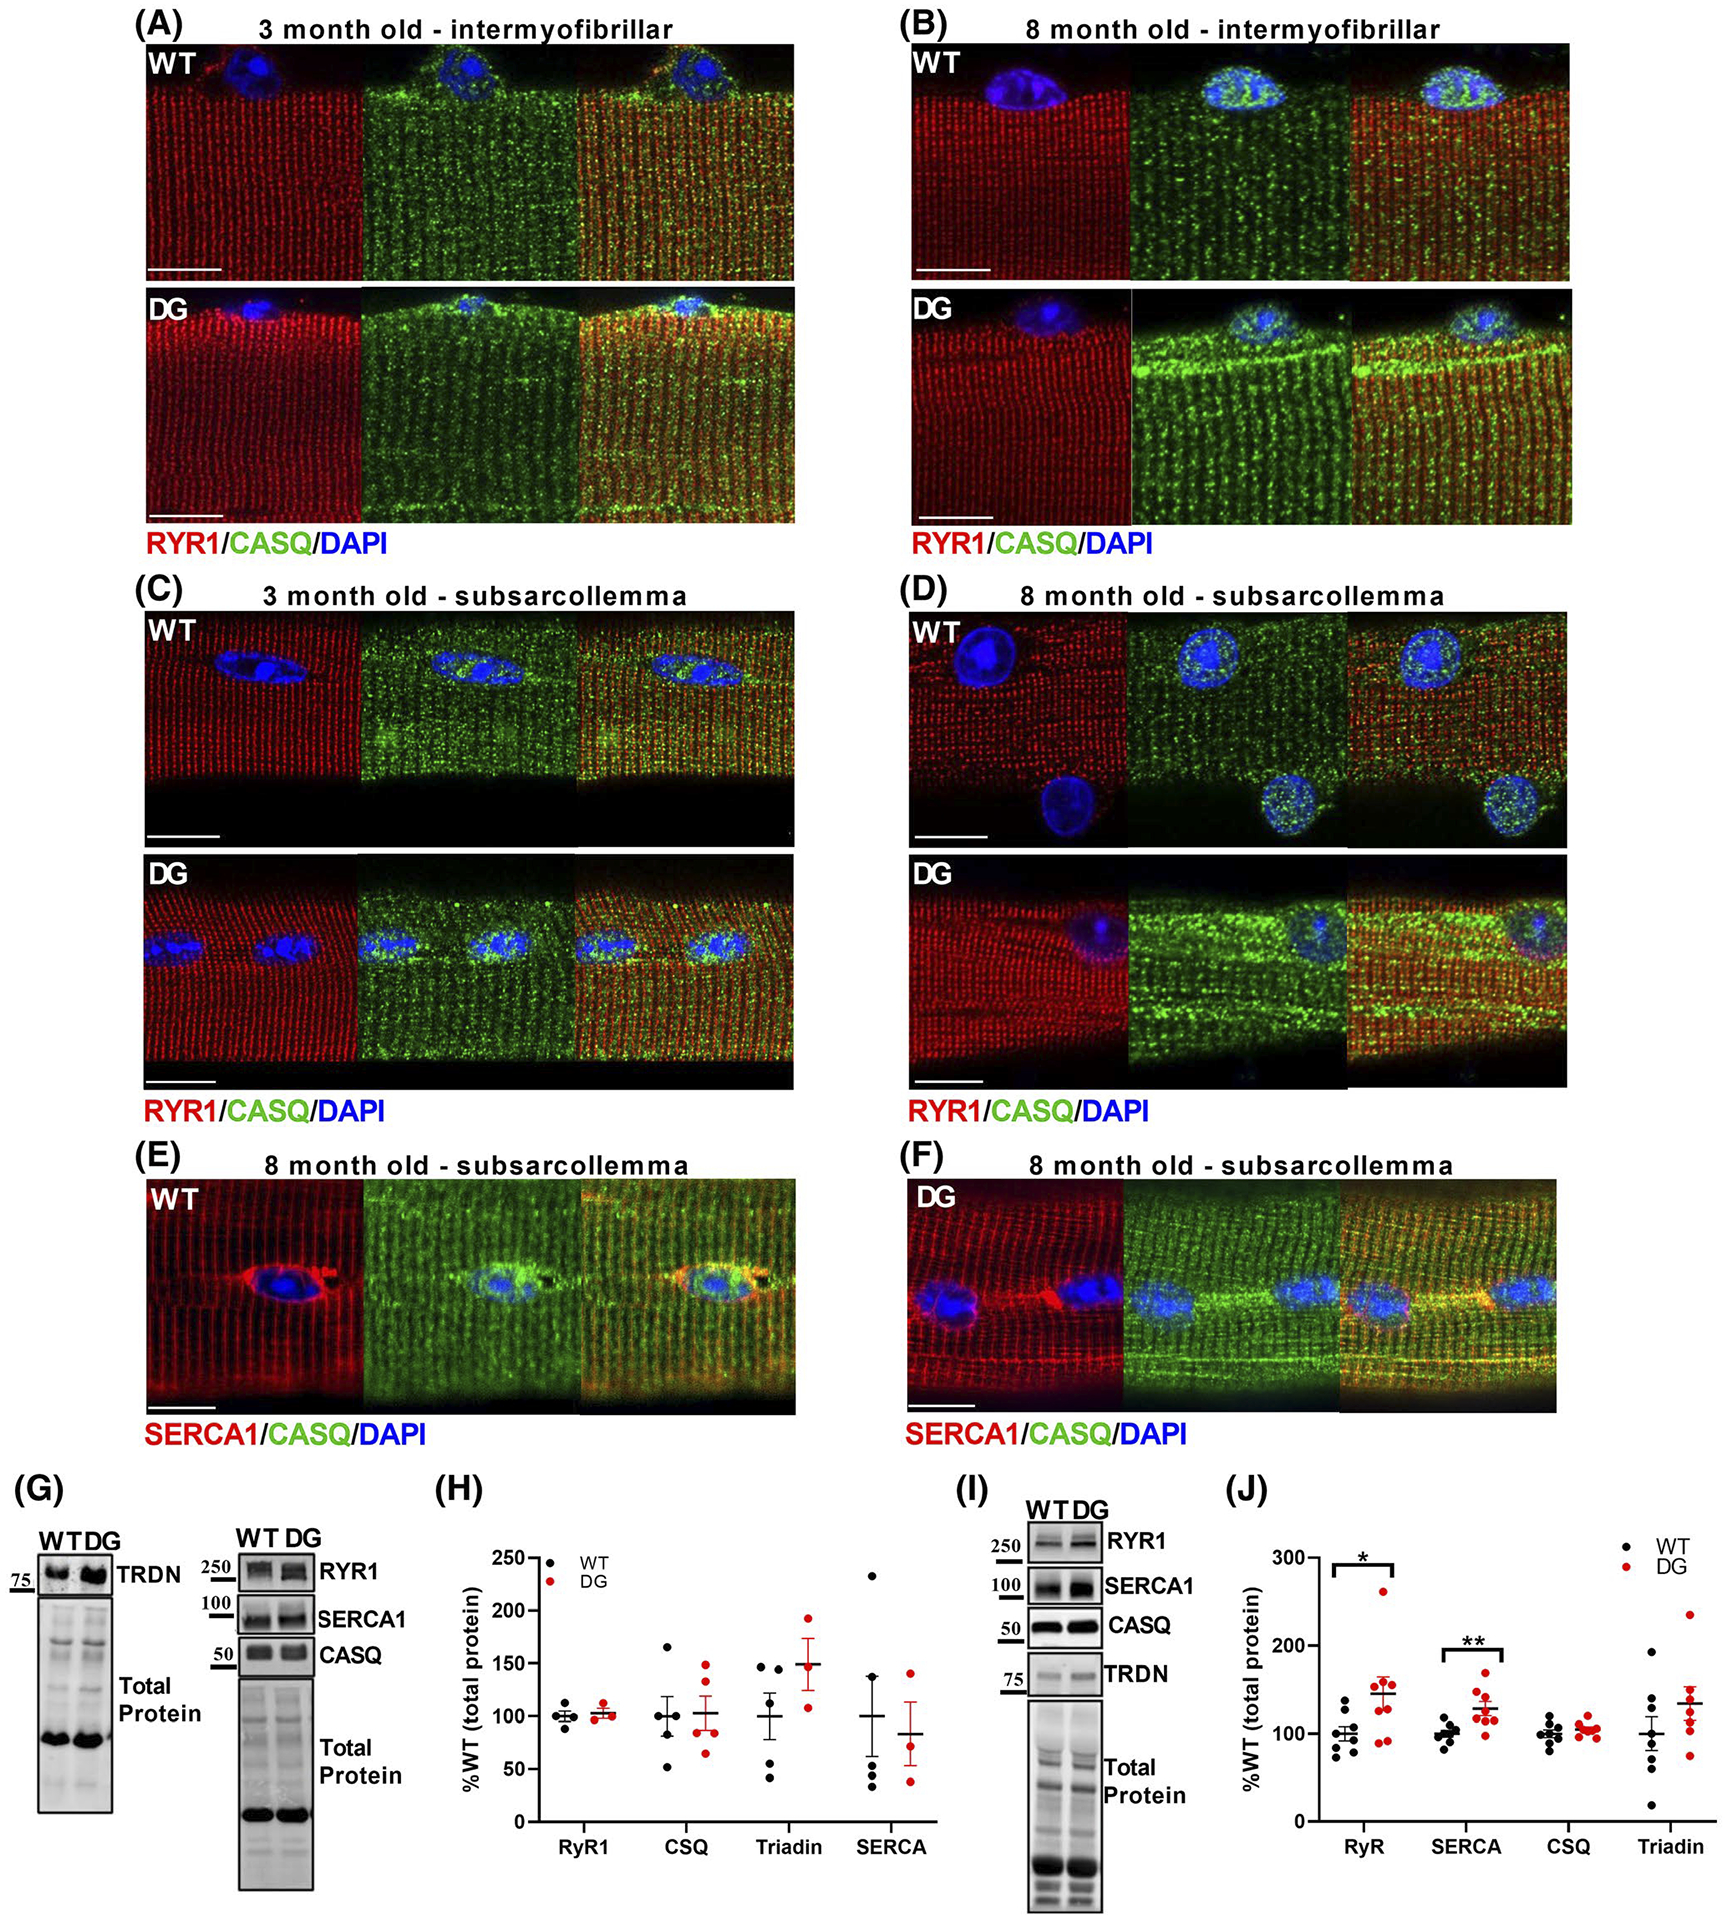
FIGURE 4.

CASQ aggregation and expression of EC Coupling Proteins. Immunofluorescence of CASQ and RyR1 in FDB fibers from 3-month-old (A, C) to 8-month-old (B, D) mice. Images were taken from the mid-z axis of the fiber (A, B) and at the sub-sarcolemmal region (C, D) of fibers. E, F, Immunofluorescence of SERCA1 and CASQ1 in FDB fibers from 8-month-old mice Scale bars are 10 μm. SR protein levels were assessed by western blot in (G, H) 3-month-old and (I, J) 8-month-old mice. G, I, Representative western blots and (H, J) quantitation of SR protein expression in WT and DG EDL muscle homogenates. Protein expression was normalized to the total protein for the lane, detected by Stain-Free imaging. Each symbol in (H) and (J) represents a single muscle from a mouse. Scale bars are 10 μm. Error bars indicate the mean ± SEM. Statistical significance is indicated by *(P < .05) and **(P < .005)
