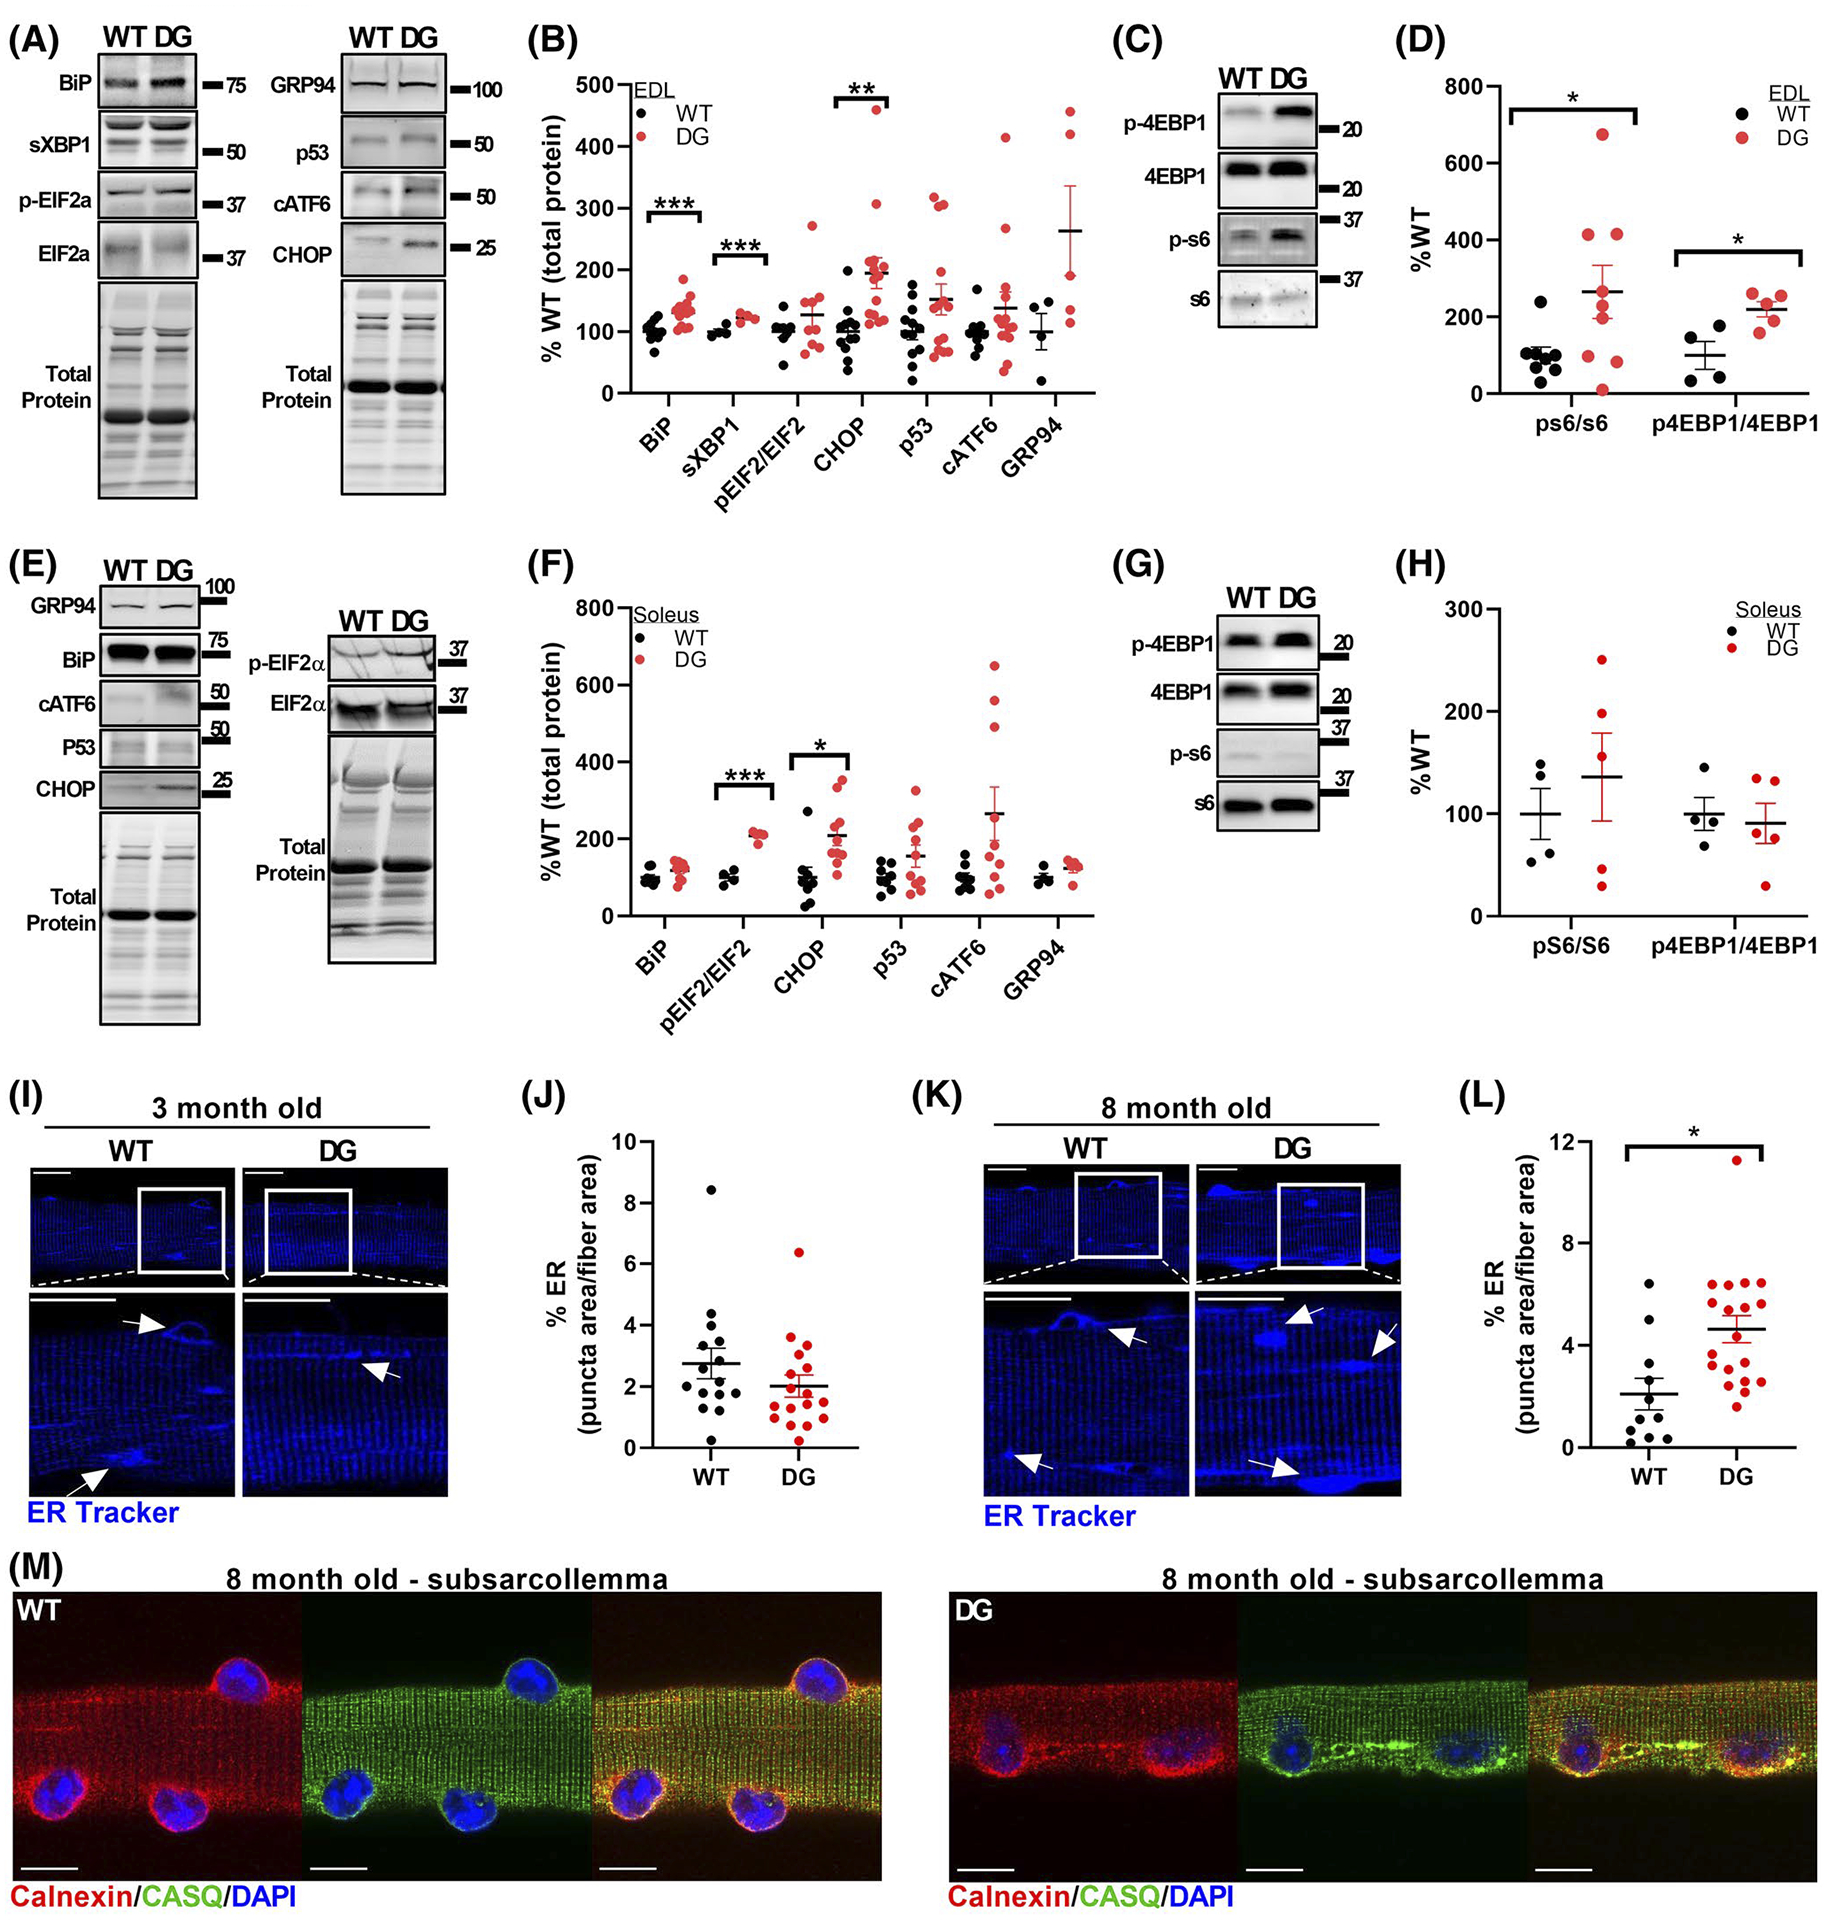
FIGURE 5.

ER stress and remodeling. Representative blots (A) and quantitation (B) of ER stress markers in EDL muscles from 8-month-old mice. Unless otherwise indicated, each ER stress marker was normalized to the total protein for that lane, as detected by Stain-Free imaging. Representative blots (C) and quantitation (D) of total and phospho-S6 and 4EBP1 in EDL homogenates of 8-month-old WT and DG mice. Each symbol in (B) and (D) represents a single muscle from an individual mouse. Representative blots (E) and quantification (F) of ER stress markers in soleus muscles from 8-month-old mice. Unless otherwise indicated, each ER stress marker was normalized to the total protein for that lane, as detected by Stain-Free imaging. Representative blots (G) and quantitation (H) of total and phospho-S6 and 4EBP1 in soleus homogenates of 8-month-old WT and DG mice. Each symbol in (F) and (H) represents a single muscle from an individual mouse. I–L, Representative ER-Tracker Blue-White staining and analysis in intact FDB fibers from WT and DG mice at 3 months (I, J) and 8 months (K, L) of age. The area of puncta that stained more brightly than the background sarcomeric ER regions were quantified and expressed as a percentage of the total fiber area. White boxes indicate regions that are expanded. Arrows indicate examples of features that were quantified. Each symbol in (J) and (L) represents a single fiber, and fibers were obtained from three WT and three DG mice. Scale bars for ER tracker stained fibers are 20 μm. M, Representative immunofluorescence of CASQ1 and calnexin from the subsarcolemmal region of 8-month-old WT and DG FDB fibers. Scale bars are 10 μm. Error bars indicate the mean ± SEM. Statistical significance is indicated by *(P < .05), **(P < .005), and ***(P < .001)
