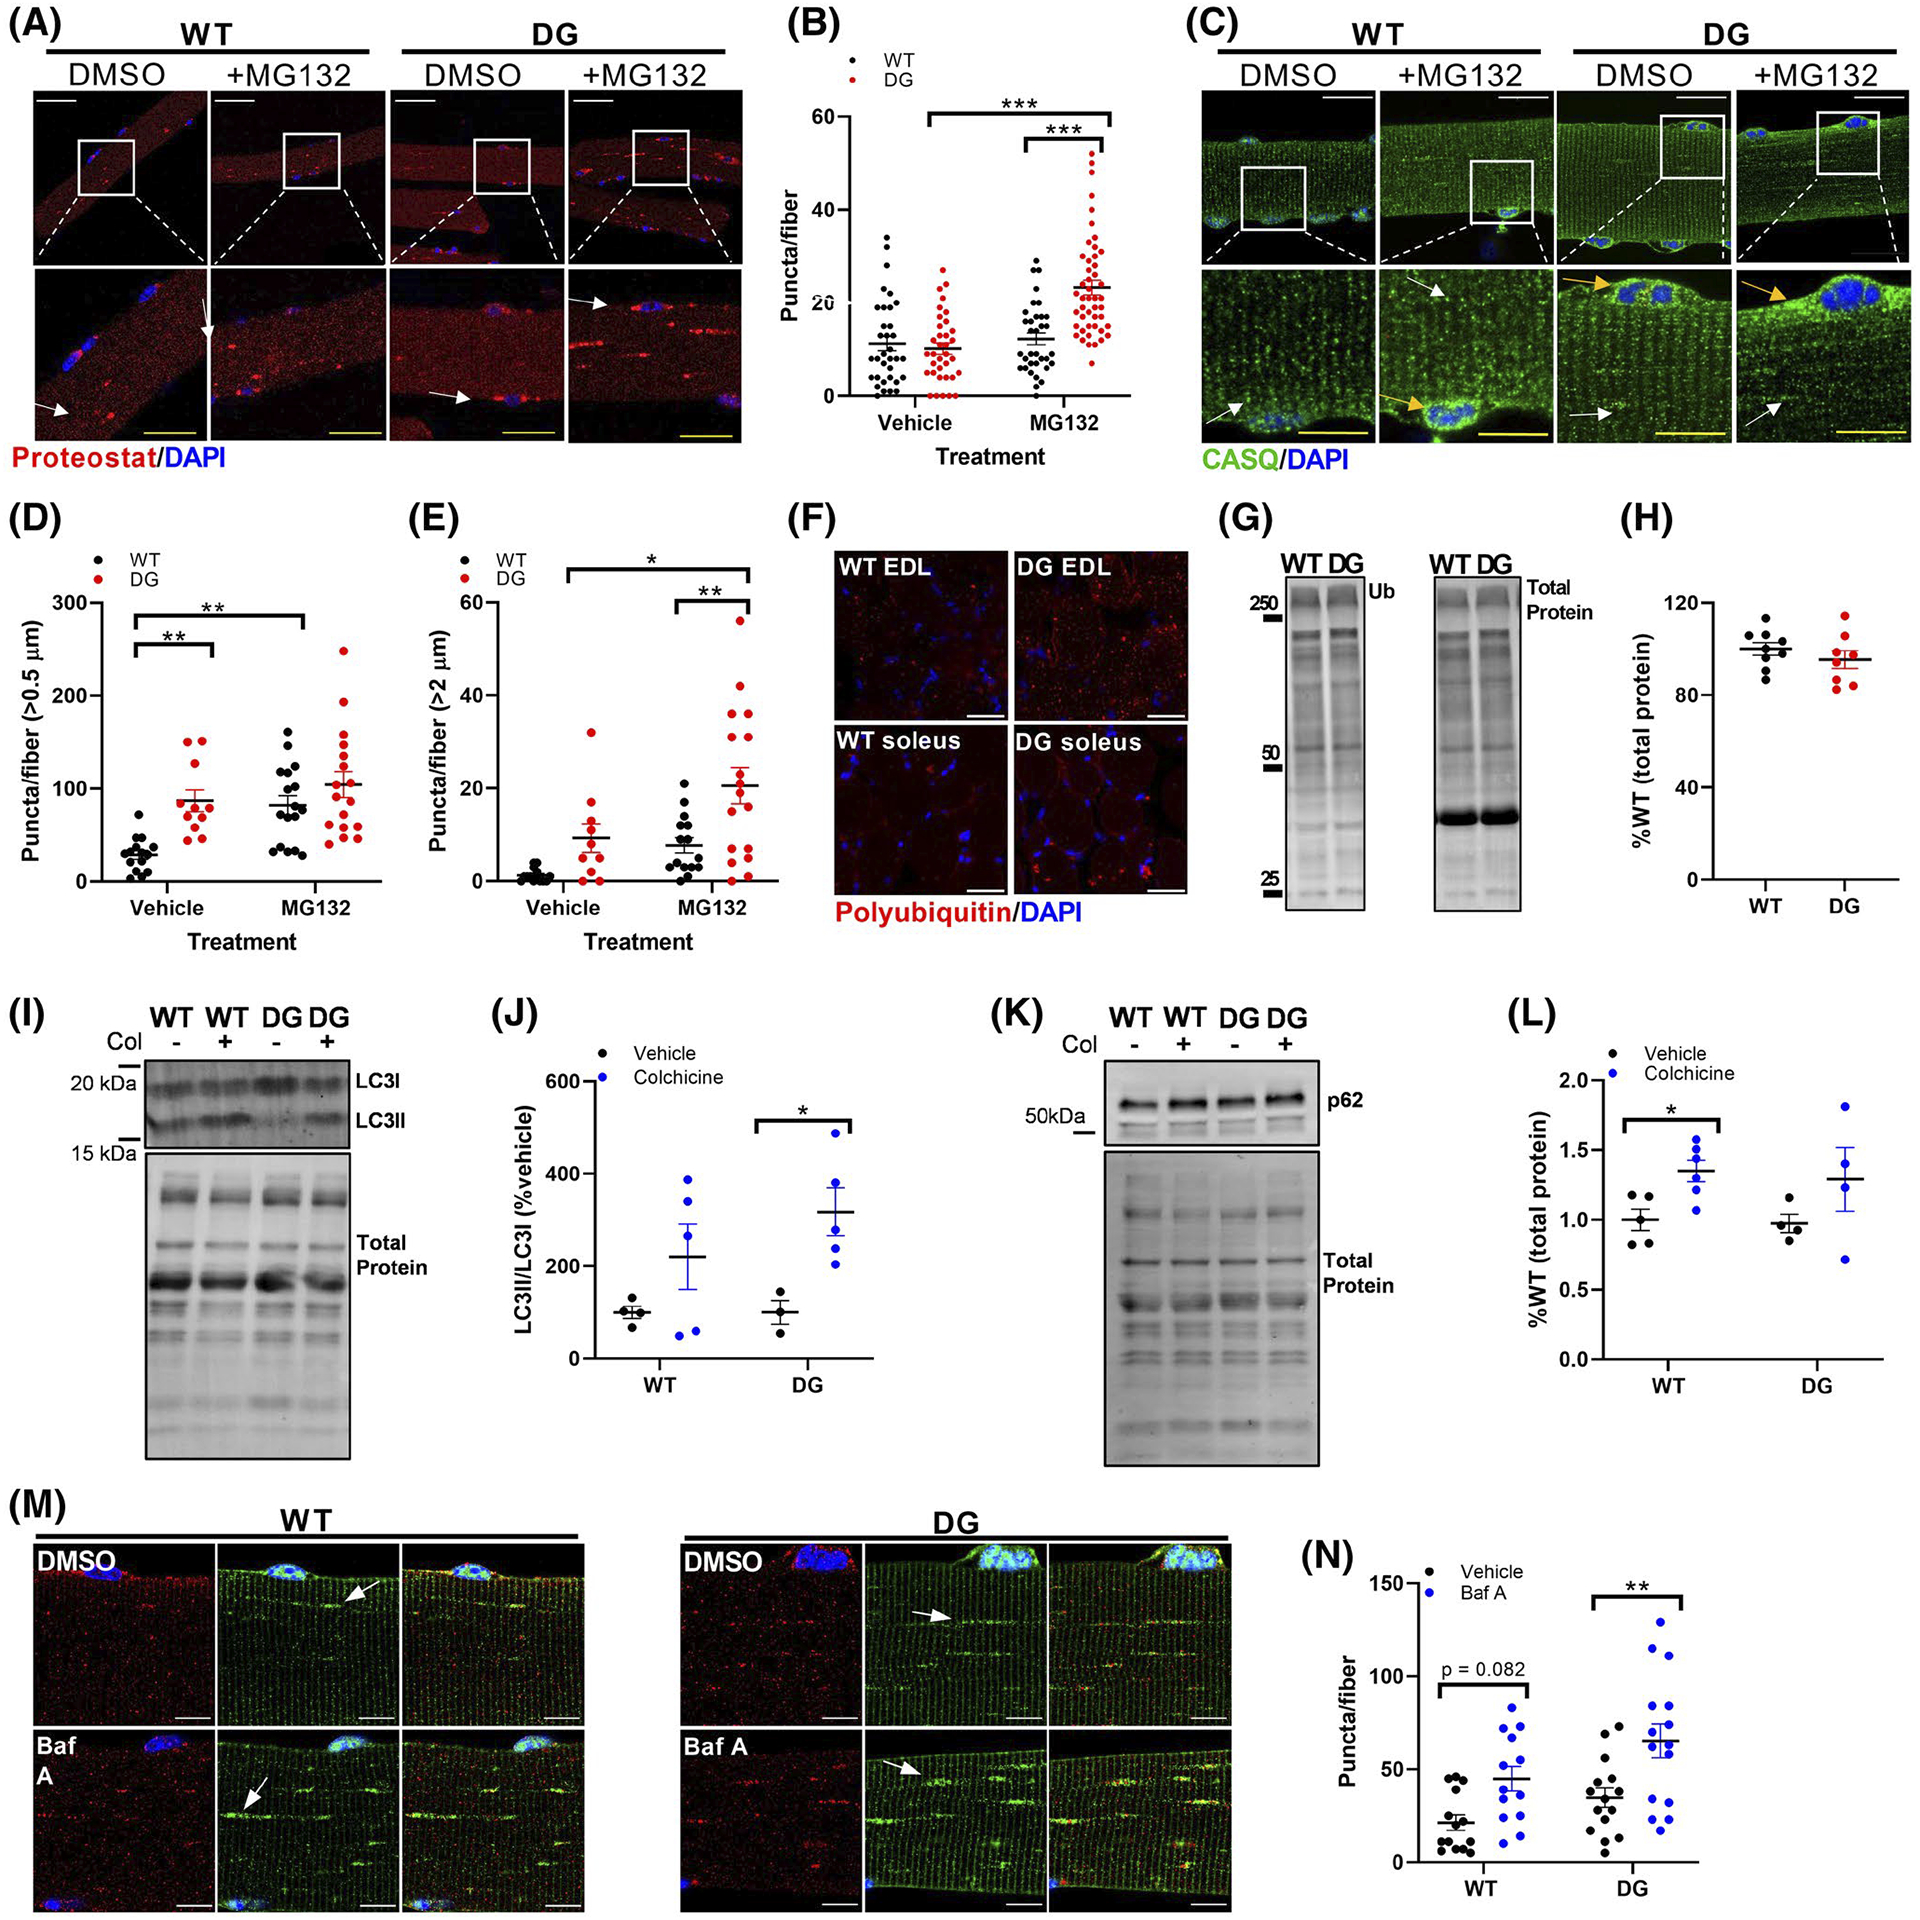
FIGURE 6.

Proteolytic function in 3-month-old mice. A, Proteostat staining of FDB fibers from WT and DG mice. Fibers were treated with either vehicle or 5 μM MG132 overnight. Red puncta indicate aggresome formation and were quantified (B) from multiple fibers from six WT and DG mice. Arrows indicate examples of features that were quantified. Each symbol in (B) represents an individual muscle fiber. White scale bars in (A) are 50 μm, yellow scale bars in expanded images are 20 μm. C, CASQ staining in vehicle and MG132-treated FDB fibers. Aggregates greater than 0.5 μm (white arrows) (D) or 2 μm (yellow arrows) (E) were quantified from multiple fibers from three WT and DG mice. White scale bars in (C) are 50 μm, yellow scale bars in expanded images are 20 μm. White boxes indicate regions that are expanded in the lower panel. F, Polyubiquitin immunofluorescence staining in EDL and soleus muscle sections from WT and DG. Scale bars are 50 μm. Representative western blot (G) and quantitation (H) of ubiquitination in EDL muscle homogenates. I, J, Representative blot and quantitation of LC3II/LC3I ratio and (K, L) p62 expression in vehicle and colchicine treated WT and DG mice. M, Representative LC3 and LAMP2 immunofluorescence in FDB fibers from 8-month-old WT and DG mice. Scale bars are 10 μm. To assess autophagic flux, fibers were treated with either DMSO or 400 nM bafilomycin A for 3 hours. N, Quantitation of LC3 puncta in FDB fibers from three pairs of WT and DG mice. Arrows indicate examples of features that were quantified. Each symbol in (D), (E) and (N) represents an individual muscle fiber. Each symbol in (H), (J) and (L) represents a single muscle from an individual mouse Error bars indicate the mean ± SEM. Statistical significance is indicated by *(P < .05), **(P < .005) and ***(P < .001)
