FIGURE 8.

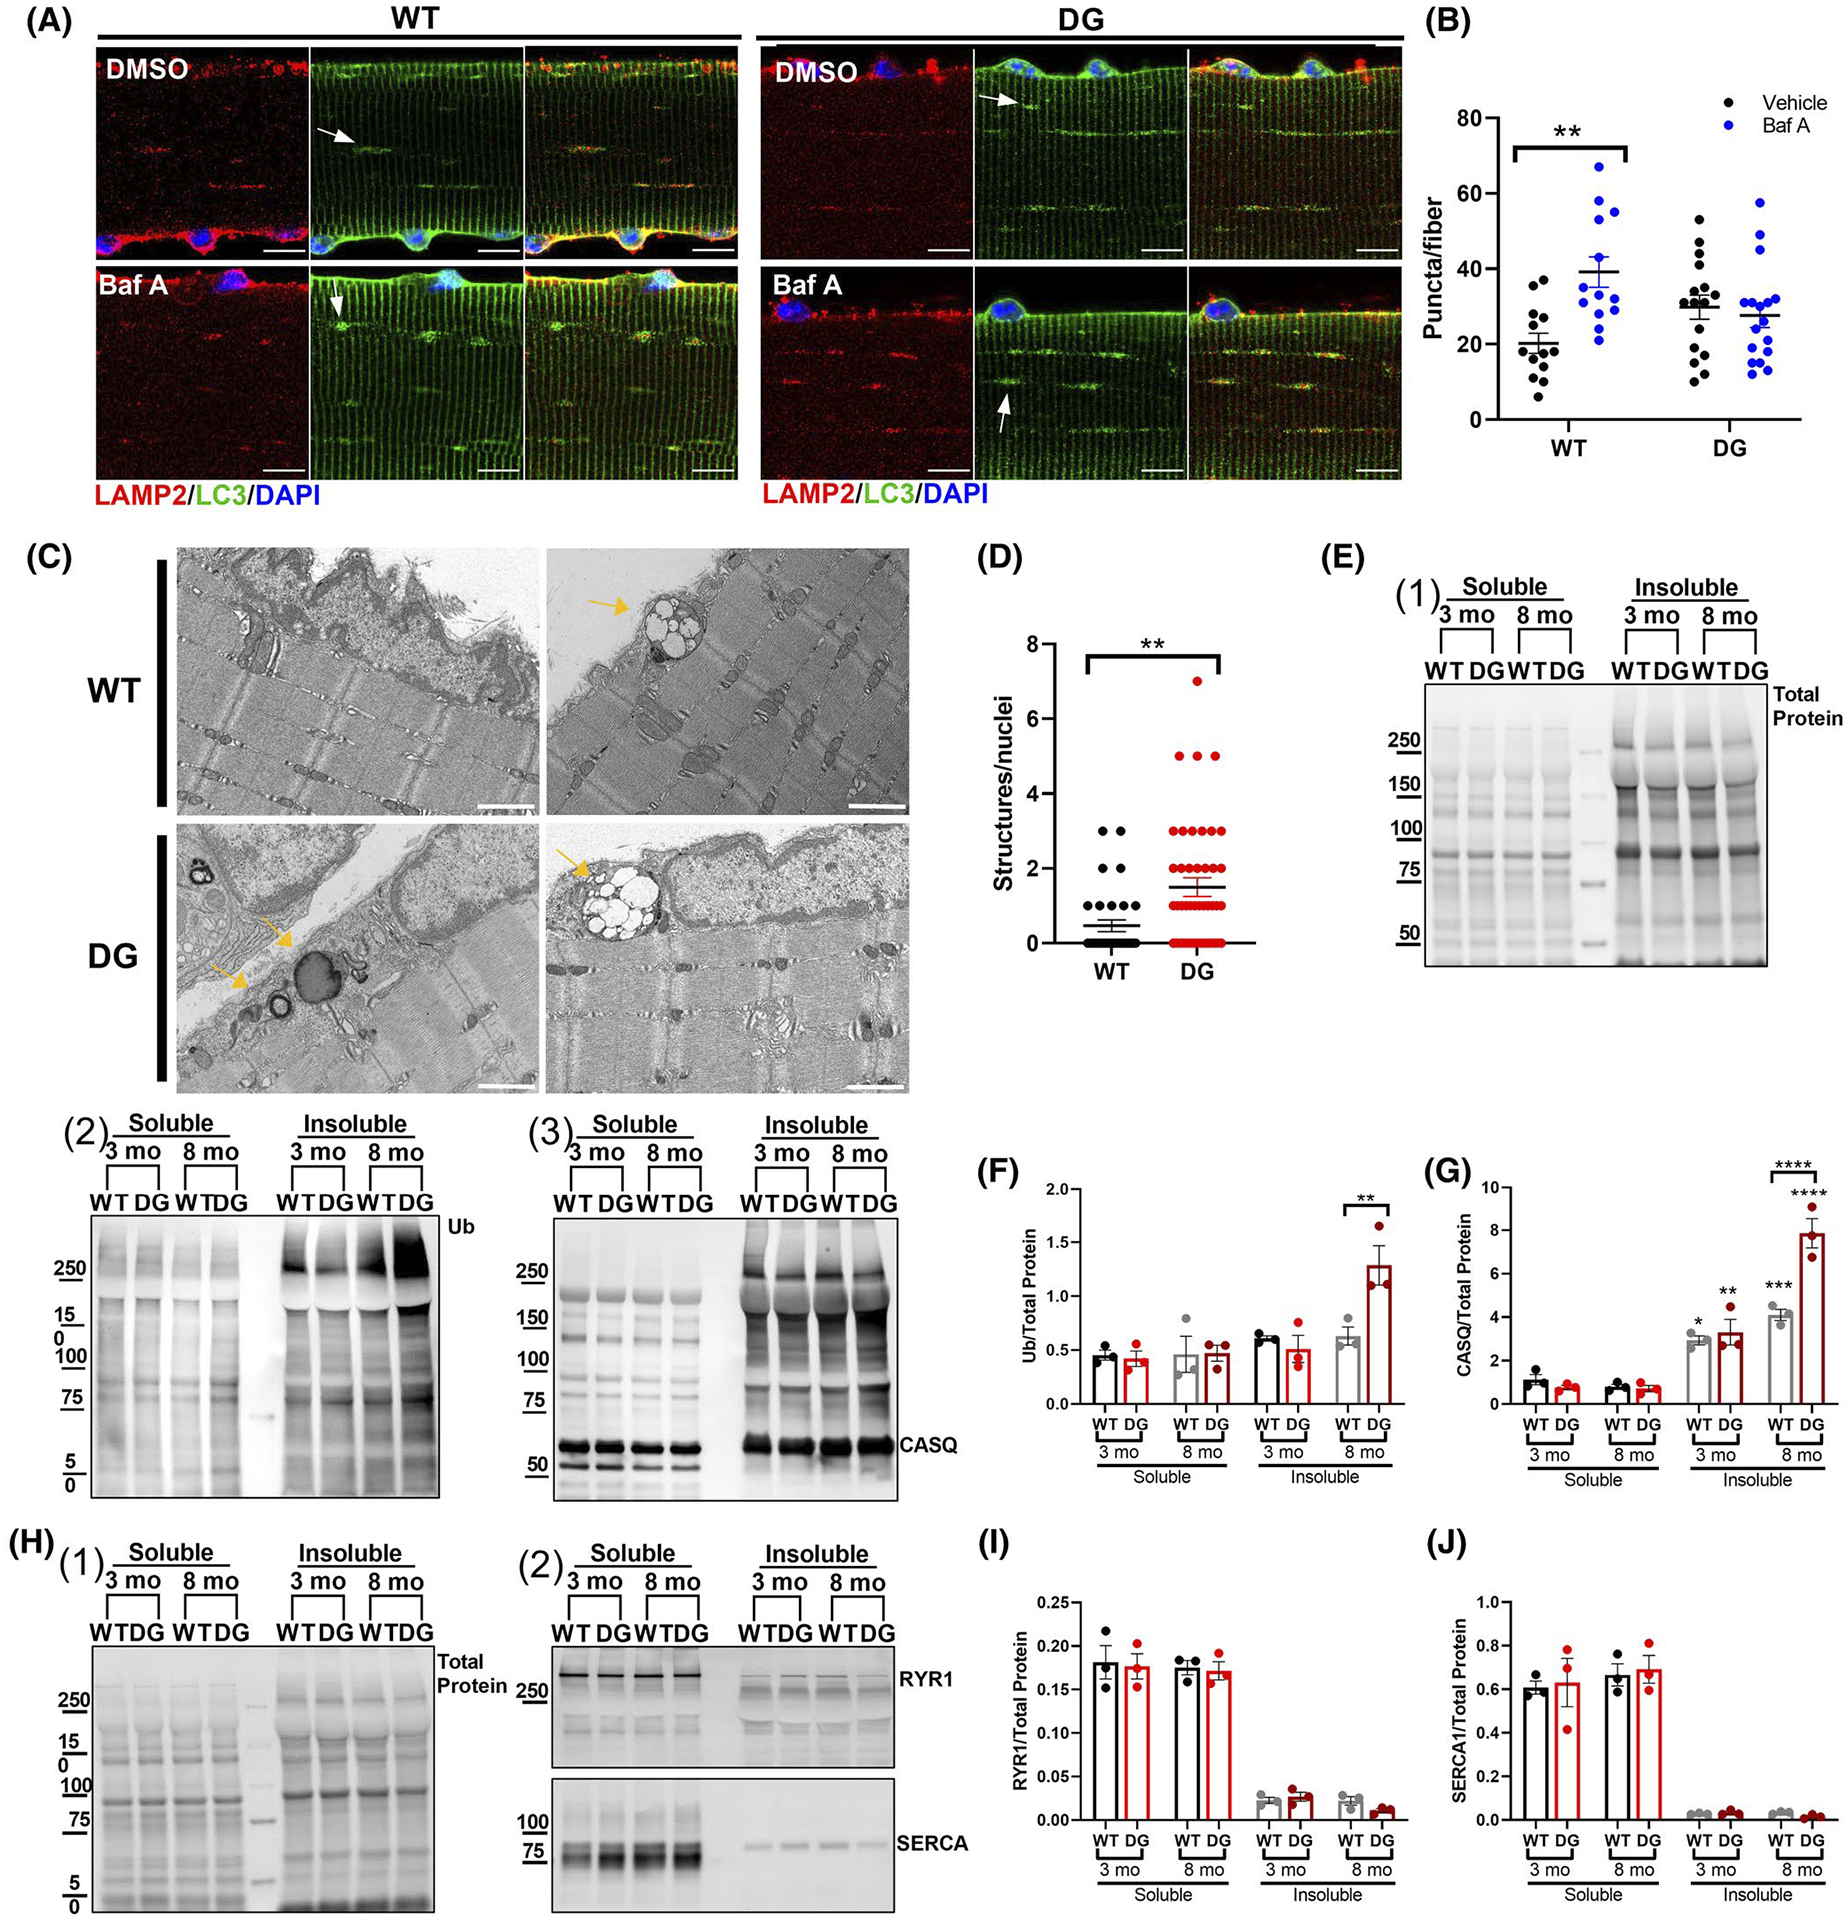
Autophagic flux and muscle fractionation in 8-month-old mice. A, Representative LC3 and LAMP2 immunofluorescence in FDB fibers from 8-month-old WT and DG mice. Scale bars are 10 μm. To assess autophagic flux, fibers were treated with either DMSO or 400 nM bafilomycin A for 3 hours. B, Quantitation of LC3 puncta in FDB fibers from three pairs of WT and DG mice. Arrows indicate examples of features that were quantified. C, Representative transmission electron micrographs from 8-month-old WT and DG EDL muscles. Scale bars are 1 μm. Arrows indicate examples of features that were quantified. D, Quantitation of multivesicular bodies and autophagic structures normalized to number of nuclei in EM images. E, Representative blots of (1) total protein, (2) ubiquitin, and (3) CASQ1 in TX-100 soluble and insoluble fractions from 3- and 8-month-old WT and DG mice. Quantitation of lane (F) ubiquitin and (G) Ub-CASQ1 normalized to the total protein. H, Representative western blots of (1) total protein and (2) RYR1 and SERCA1 in TX-100 soluble and insoluble fractions. Quantitation of (I) RYR1 and (J) SERCA1 western blots normalized to the total protein of the lane. Error bar indicate the mean ± SEM. Statistical significance is indicated by *(P < .05) and **(P < .005)
