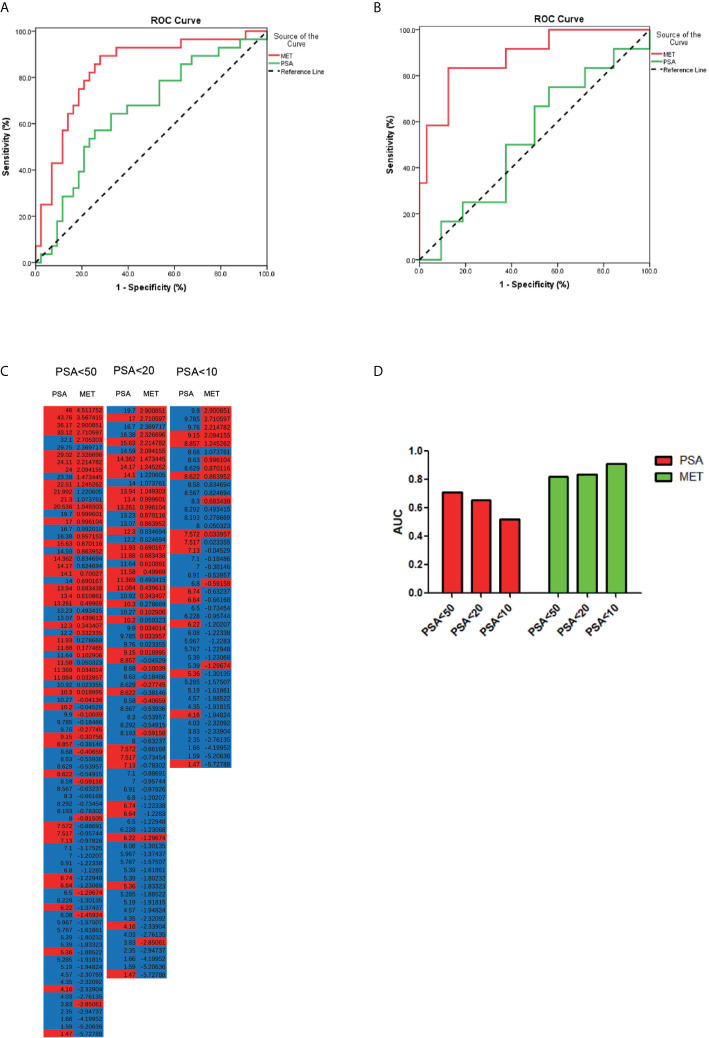
Figure 3.
The PCa detection in different PSA levels. (A) ROC curve for the patients with PSA level less than 20 ng/μl. (B) ROC curve for patients with PSA level less than 10 ng/μl. (C) The accuracy of diagnosis using serum PSA or MET panel in different PSA levels. (D) The AUC of PCa diagnosis using PSA or MET panel in different PSA levels.

