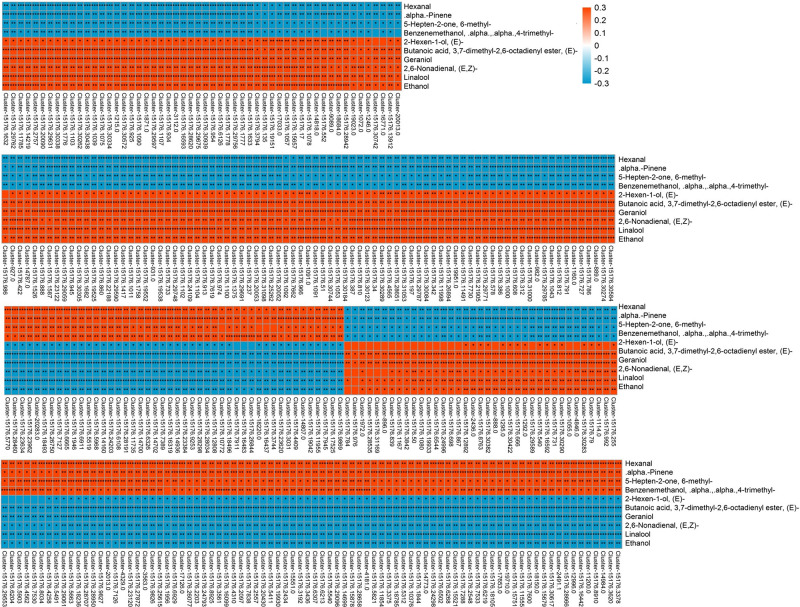
FIGURE 5.
Correlation analysis of transcriptome and volatile profiles of mango pulp samples from the 8 DAP vs. 0 DAP group. The X-coordinate is the transcript name, and the Y-coordinate is the metabolite name. Each square represents the correlation and significance of the transcript and the metabolite. The correlation coefficient is presented based on different colors and shades. Red represents a positive correlation and blue represents a negative correlation. The darker the color, the higher the correlation. The names of the identified compounds and their related unigene-id are tabulated in Supplementary Table 1.

