FIGURE 3.
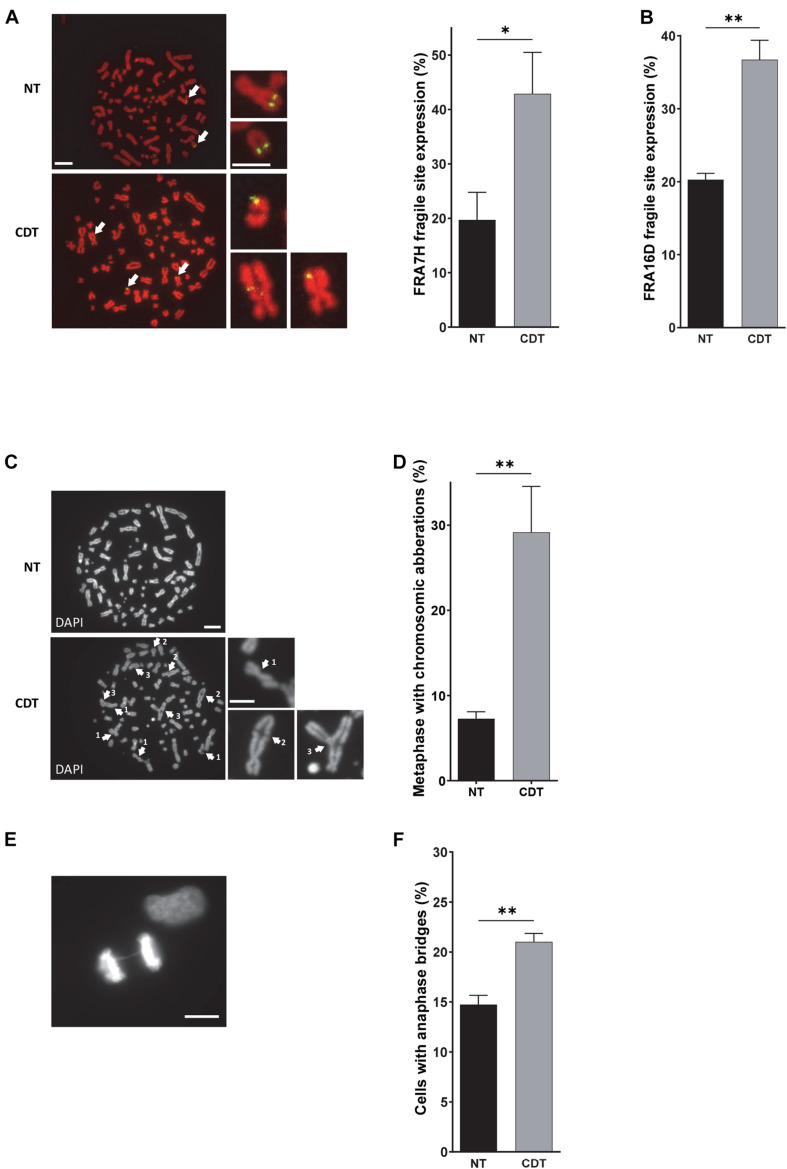
CDT induces the expression of fragile sites, global chromosomic aberrations, and anaphase bridges. (A) Illustration and quantification of metaphases with the expression of the common fragile site FRA7F (green) analyzed by fluorescence in situ hybridization (FISH) in U2OS cells treated or not with 250 pg/ml of CDT from E. coli (CDT). The chromosomes were stained with DAPI (red). Images were obtained with a wide-field fluorescent microscope. N > 30 metaphases, scale bar: 10 μm (5 μm, chromosome magnification). (B) Quantification of metaphases with the expression of the common fragile site FRA16D analyzed by FISH in U2OS cells treated or not (NT) with E. coli CDT (CDT) for 53 h. Illustration (C) and quantification (D) of metaphases containing at least one chromosomic aberration in U2OS cells treated or not (NT) with 250 pg/ml of CDT from E. coli (CDT) during 53 h. The chromosomes were stained with DAPI (grayscale). Images were obtained with a wide-field fluorescent microscope. N > 60 metaphases; white arrows indicate chromosomal abnormalities such as DNA break (1), end-to-end fusion (2), and triradial chromosomes (3). Scale bar: 10 μm (5 μm, chromosome magnification). Representative image of DAPI (grayscale) staining (E) and quantification (F) of anaphases with DNA bridge in HeLa cells treated or not (NT) with 100 pg/ml of CDT from E. coli (CDT) for 24 h. N > 90 anaphases were analyzed with a wide-field fluorescent microscope. Scale bar: 10 μm (mean ± SEM of at least three independent experiments) [∗P < 0.05, ∗∗P < 0.01, versus non-treated (NT)].

