FIGURE 5.
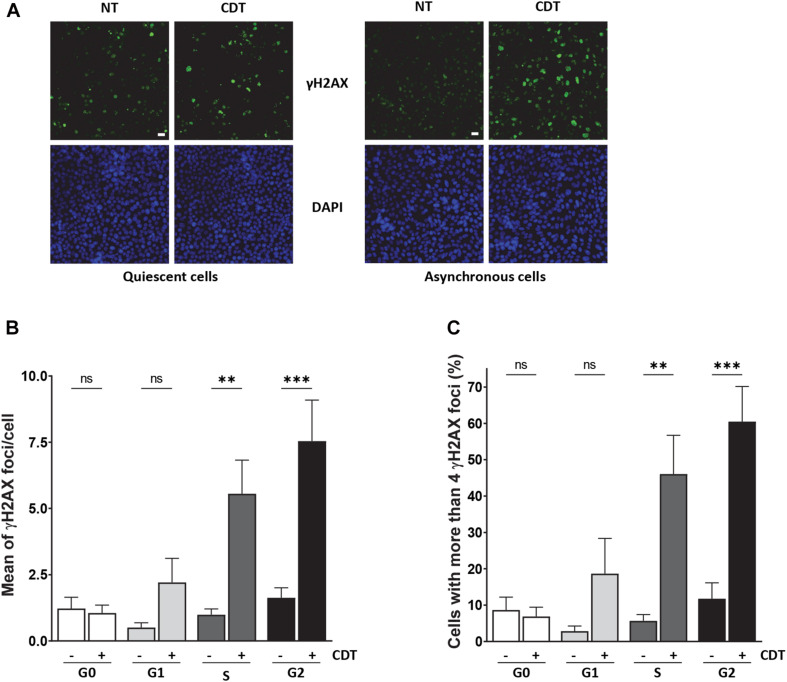
CDT induces γH2AX foci formation preferentially in proliferating cells. (A) Representative images of γH2AX (green) immunostaining in quiescent or proliferating RKO cells after exposure or non-exposure (NT) with E. coli CDT (25 ng/ml) for 7 h. DNA was stained with DAPI (blue). Scale bar: 20 μm. (B) Quantification by ArrayScan analysis of γ-H2AX foci formation in quiescent or proliferating RKO cells sorted according to cell cycle phase after CDT treatment from E. coli (25 ng/ml) for 7 h. (C) Quantification of γH2AX-positive cells with > 4 foci/nuclei in cells treated as in (B). For each analysis, a minimum of 1,000 cells were analyzed with a wide-field fluorescent microscope (ArrayScan technology) in three independent experiments [∗∗P < 0.01, ∗∗∗P < 0.001 versus non-treated (NT); ns, not significant].

