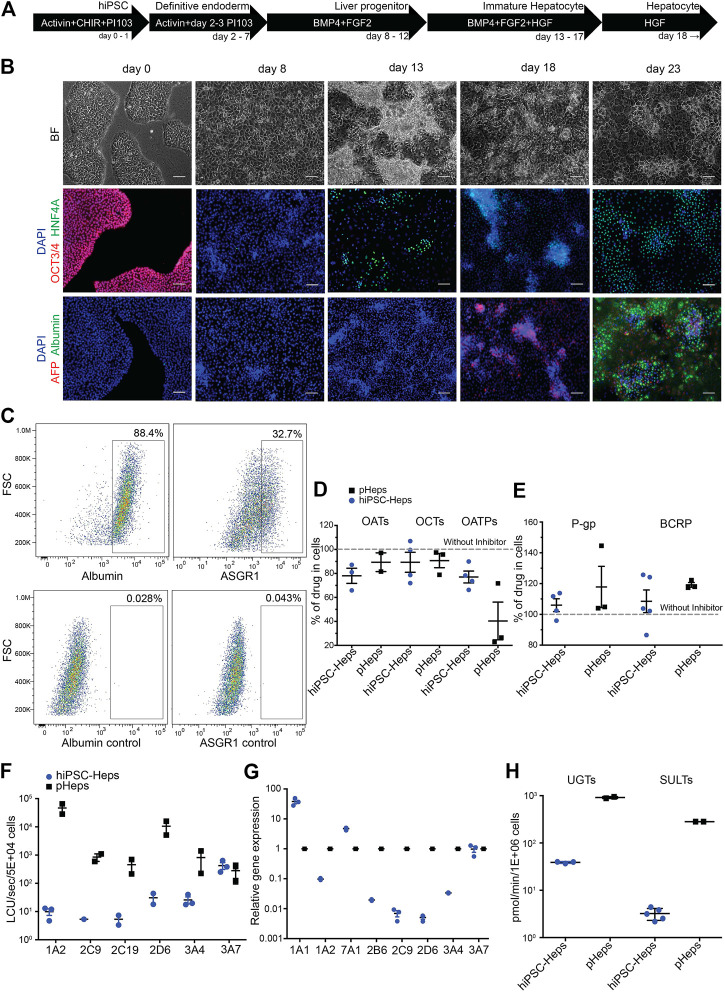
FIGURE 1.
Differentiation and characterization of hiPSC-Heps. (A) Schematic of the hiPSC-Hep differentiation protocol. The arrows show cells at different stages progressing from hiPSCs (day 0) to mature hepatocytes (day 23). Growth factors and small molecules are listed inside the arrows. (B) Brightfield and immunofluorescent images matching the differentiation stages in (A). Nuclei were stained with DAPI. Scale bars, 100 µm. (C) Flow cytometry shows percentage of hiPSC-Heps expressing albumin and ASGR1 at day 23. (D) Activity analysis of uptake transporters by inhibition with specific inhibitors. Results obtained without inhibitors were set to 100% to display transporter activity as decrease of drug concentration in the cells. Data are presented as the mean ± standard deviation from three to four (hiPSC-Heps) or two to three (pHeps) independent experiments. (E) Activity analysis of efflux transporters by inhibition with specific inhibitors. Results obtained without inhibitors were set to 100% to display transporter activity as increase of drug concentration in the cells. Data are presented as the mean ± standard deviation from four to five (hiPSC-Heps) and three (pHeps) independent experiments. (F) Activity analysis of CYPs. Data are presented as the mean ± standard error of the mean from three (hiPSC-Heps) or two (pHeps) independent experiments. (G) Quantitative reverse transcription PCR analysis of CYP genes. (H) Activity analysis of conjugating enzymes. Data are presented as the mean ± standard deviation from two (UGTs, SULTs; pHeps), three (UGTs; hiPSC-Heps), or five (SULTs; hiPSC-Heps) independent experiments.

