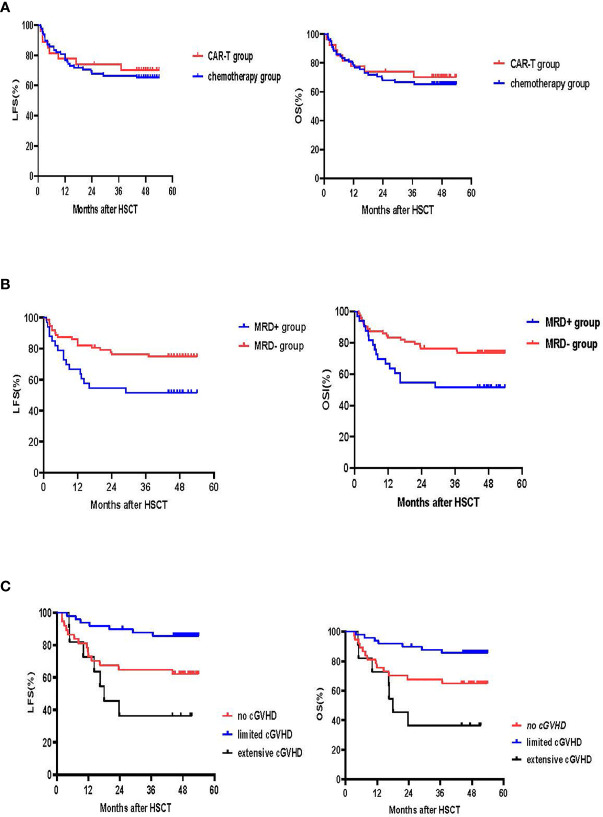
Figure 5.
LFS and OS. (A) LFS and OS in the CAR-T and chemotherapy groups. The 4-year LFS for the CAR-T group was 70.2% (95% CI:53.0, 87.4%) vs. 64.1% (95% CI:53.5, 74.7%) for the chemotherapy group (p=0.63). The 4-year OS for the CAR-T group was 70.2% (95% CI:53.0, 87.4%) vs. 65.4% (95% CI:54.8, 76.0%) for the chemotherapy group (p=0.681) (B) LFS and OS according to MRD. The 4-year LFS for patients who achieved MRD- CR was 72.2% (95% CI:61.8, 82.6%) and 51.5% (95% CI:34.4, 68.6%) for those that had an MRD+ CR (p=0.024). The 4-year OS for the MRD- CR group was 73.6% (95% CI:63.4, 83.8%) and 51.5% (95% CI:34.4, 68.6%) for the MRD+CR group (p=0.02). (C) LFS and OS according to cGVHD. 4-year LFS for patients without cGVHD was 62.2% (95% CI:46.5, 77.9%), 85.6% (95% CI:75.8,95.4%) for those with limited cGVHD and 36.4% (95% CI:8.0, 64.8%) for those with extensive cGVHD (no vs. limited cGVHD, p=0.009; limited vs. extensive cGVHD, p<0.001; no vs. extensive cGVHD, p=0.20). 4-year OS for the no cGVHD group was 64.9% (95% CI:49.6, 80.2%), 85.6% for the limited cGVHD group (95% CI:75.8, 95.4%) and 36.4% for the extensive cGVHD group (95% CI:8.0, 64.8%) (no vs. limited cGVHD, p=0.019; limited vs. extensive cGVHD, p<0.001; no vs. extensive cGVHD, p=0.123).

