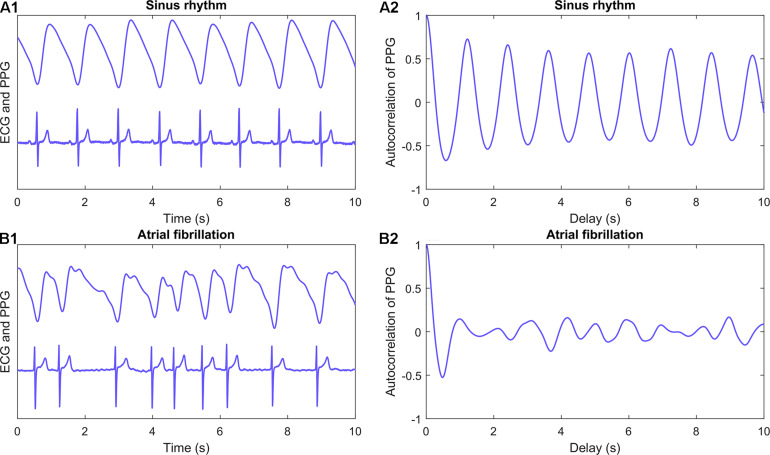
FIGURE 3.
Autocorrelation. PPG (upper) and ECG (lower) recordings from a patient with sinus rhythm (A1) and atrial fibrillation (B1). Corresponding autocorrelation values were calculated for 1-min samples of PPG signal for each patient. First 10 s of example recordings and calculated autocorrelation values (A2 and B2) are shown in panels. Autocorrelation is a feature calculated straight from the signal and it requires no pulse detection. It is the correlation between a signal and its delayed copy as a function of delay. ECG, electrocardiogram; PPG, photoplethysmography.

