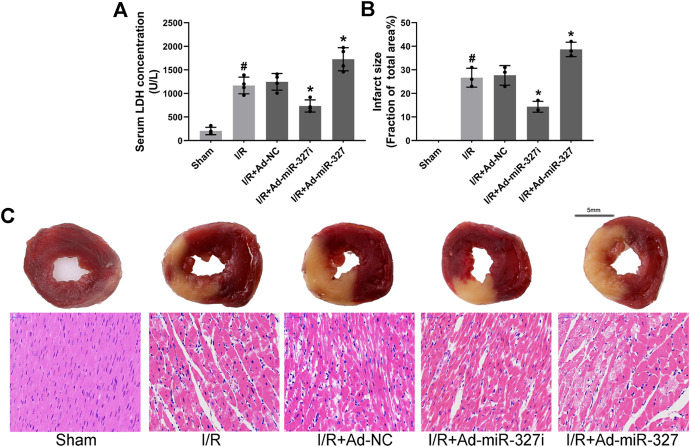
FIGURE 9.
Effects of miR-327 on MI/RI in rats. Serum LDH concentration (n = 4) in each group (A). Assessment of myocardial infarction by TTC staining (n = 3) and HE staining. For TTC staining, the red area represents non-infarcted tissue, while the white area represents infarcted tissue (C), and myocardial infarct size expressed as (white area)/(white area + red area) (B). Representative images of HE staining in each group (C). Data are expressed as the mean ± SD; #p < 0.05 versus the Sham group; *p < 0.05 versus the Ad-NC group.

