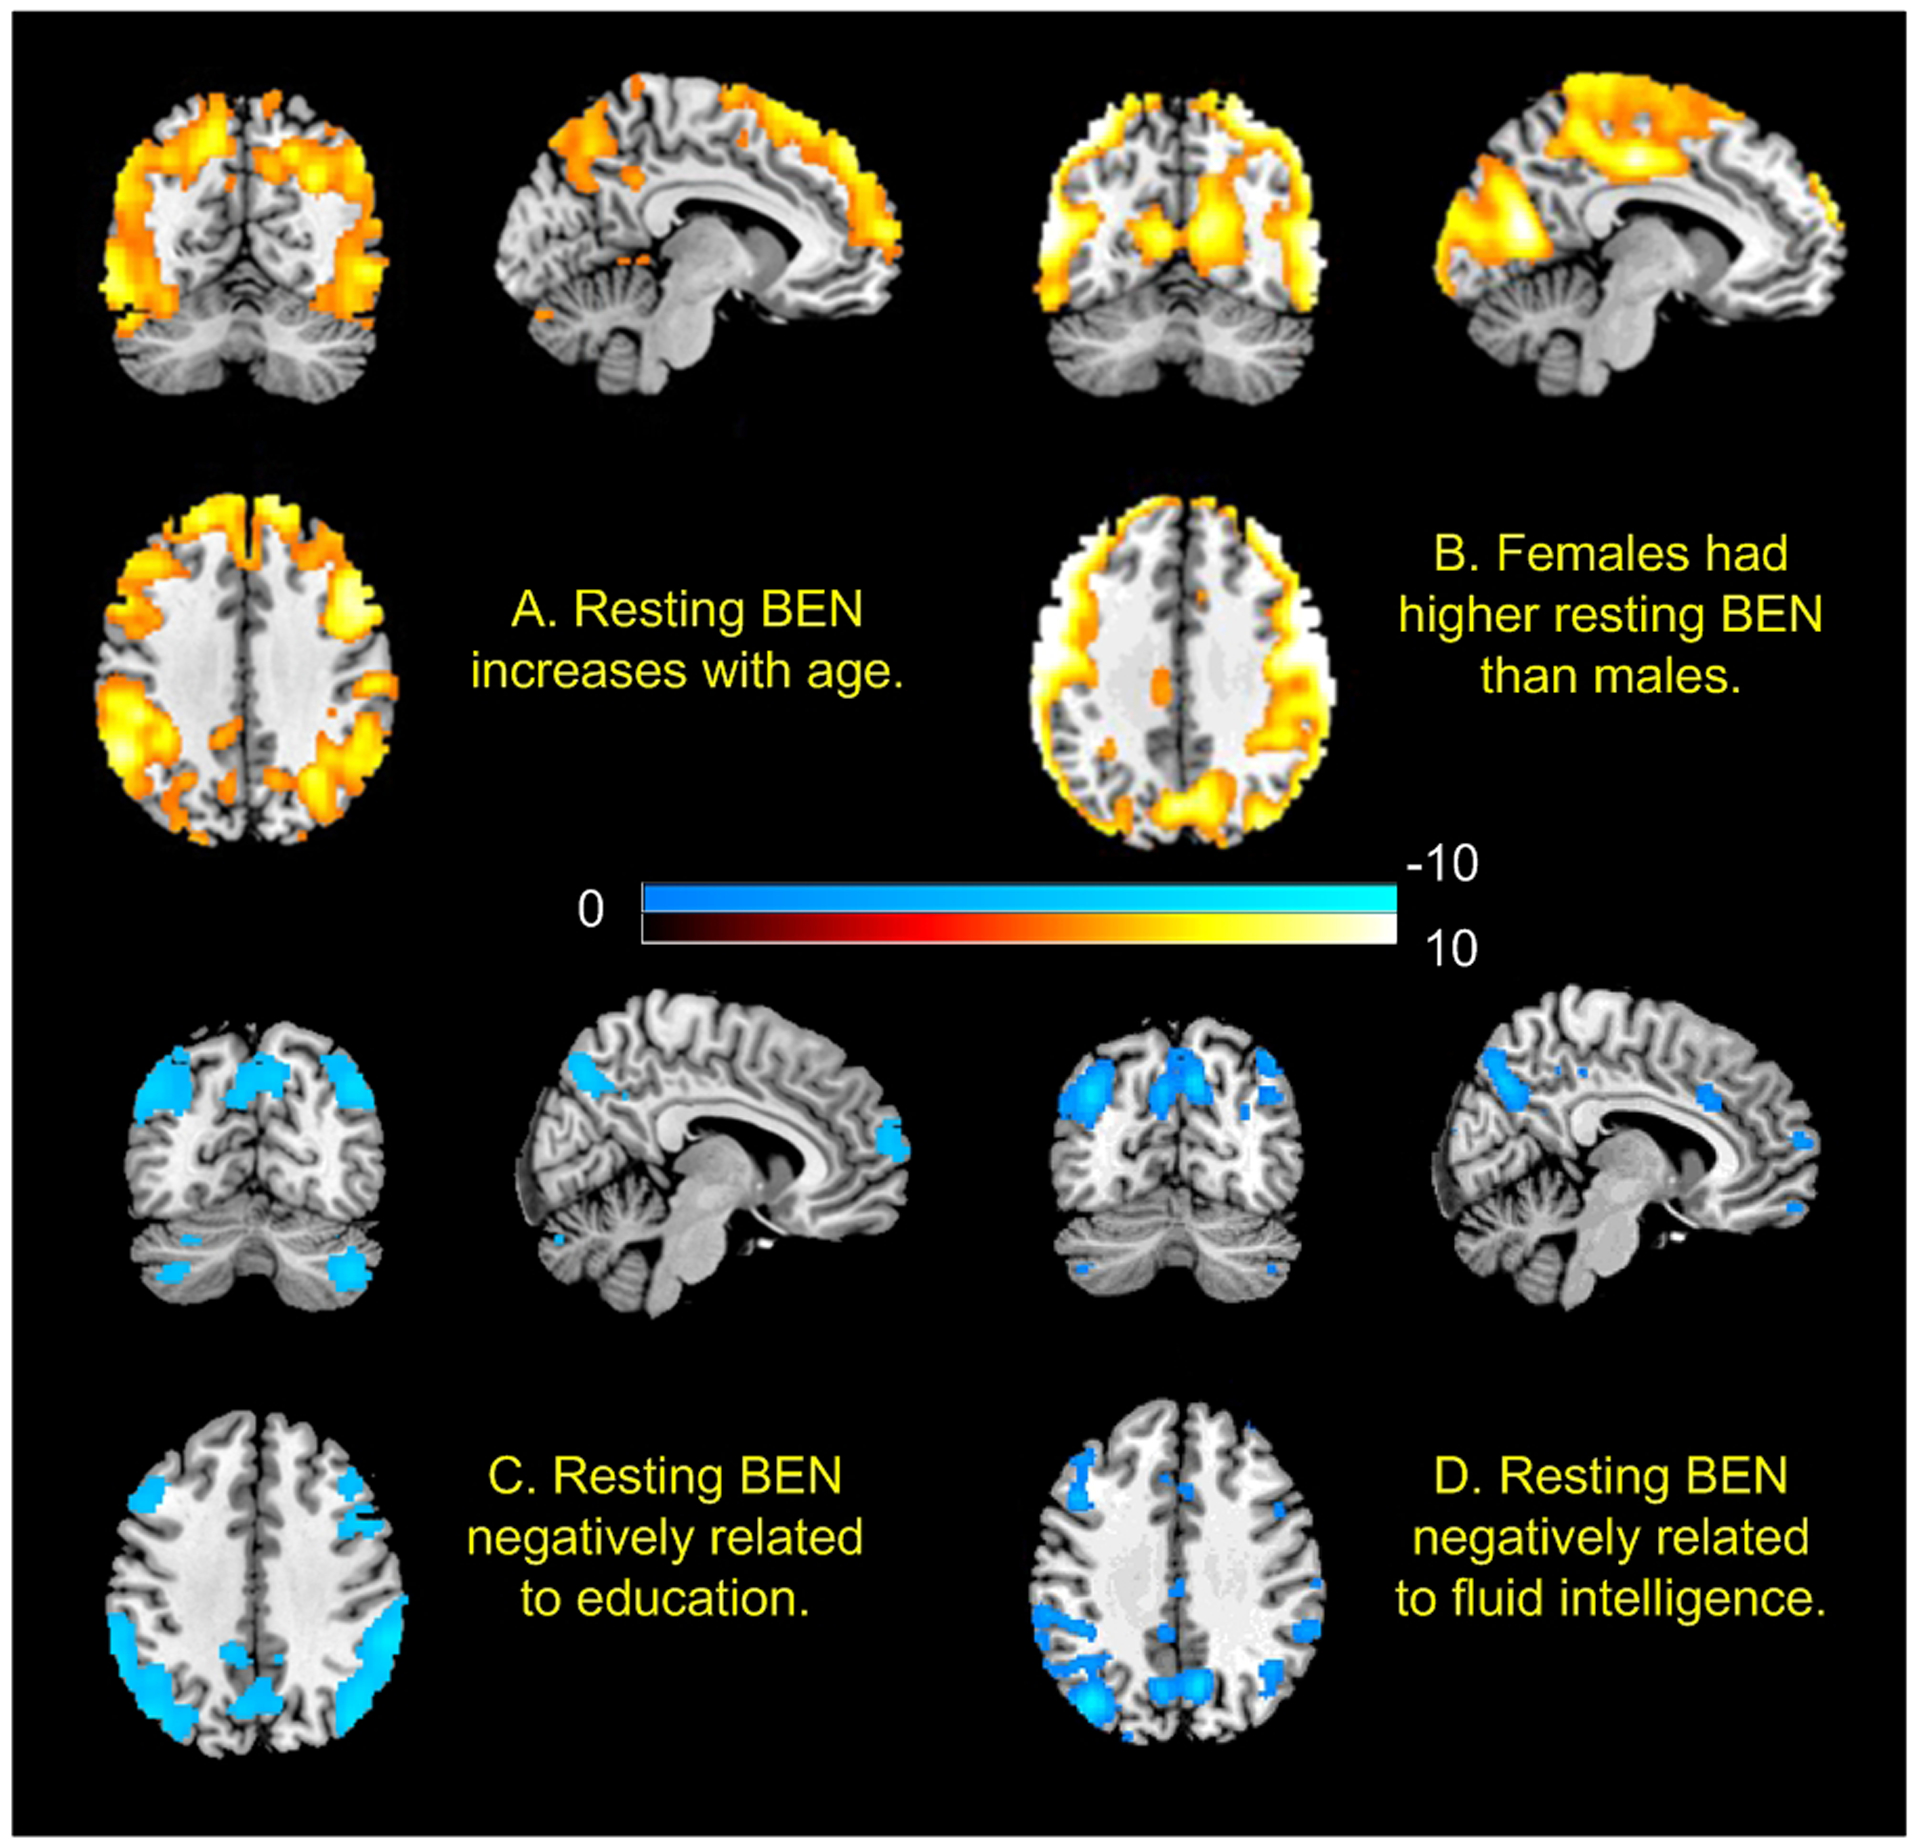
Fig. 4.

The age, sex, and education effects on resting BEN as well as the associations of resting BEN with fluid intelligence. n = 862. Statistical significance level was p<0.05 (FWE corrected). Red/blue colors indicate positive/negative correlations, respectively. Color bars indicate the t-values of the regression analyses (A, C, and D) and the two-sample t-test (B).
