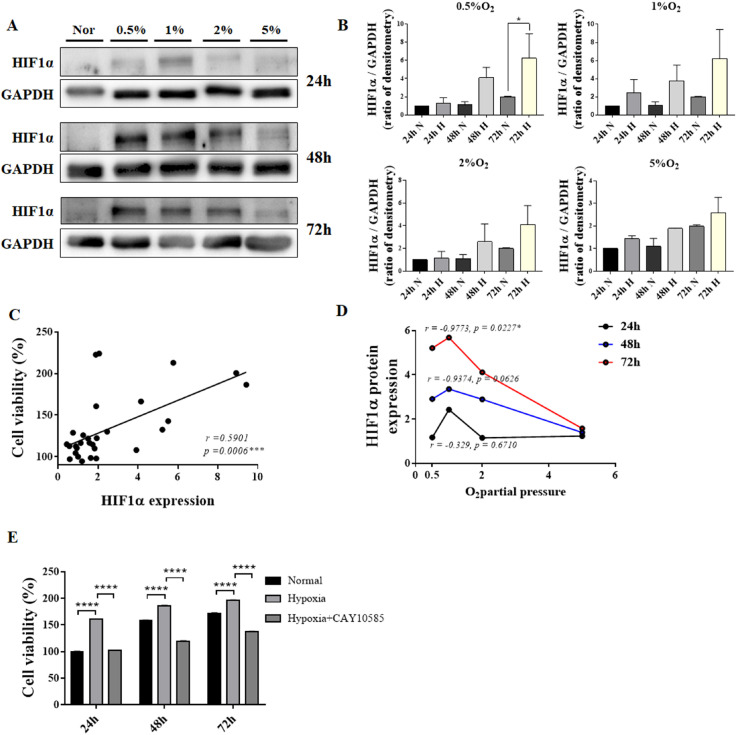
Fig. 2.
Correlation between HIF1α protein expression and cell viability of hES-MSCs under various hypoxic conditions. (A) HIF1α protein expression under normal and hypoxic conditions. (B) HIF1α protein quantification using densitometry. (C) Correlation between cell viability and HIF1α relative expression. (D) HIF1α protein expression at various low O2 partial pressures. (E) Cell viability comparison with or without HIF1α inhibitor in hypoxia; (n=6, mean±SEM; ns, *p<0.05, **p<0.01, ***p<0.001 and ****p<0.0001 vs. normal condition using One-way ANOVA-Dunnett’s multiple comparison test).

