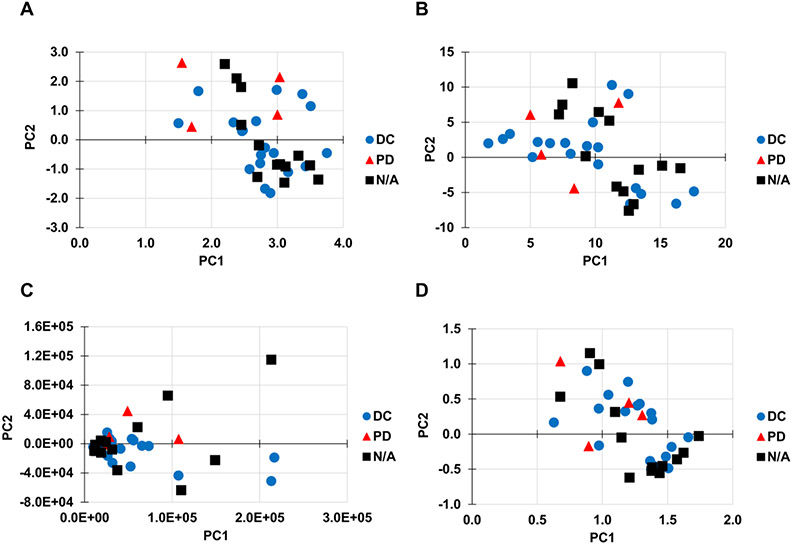
Figure 3. Effect of pre-treatment and imputation methods on PCA scores.
Representative PCA score plots of all 36 samples in the data set. The following pre-treatment methods and imputation methods were applied: (A) Vast scaling and CART imputation, (B) Level scaling and CART imputation, (C) Pareto scaling and RF imputation, (D) Range scaling and RF imputation. Panels A and C achieved a statistically significant separation between the disease control (DC) and progressive disease (PD) groups (p ≤ 0.05), while panels B and D did not reach significance. N/A: not applicable (sample was not used for patient categorization in our dataset).

