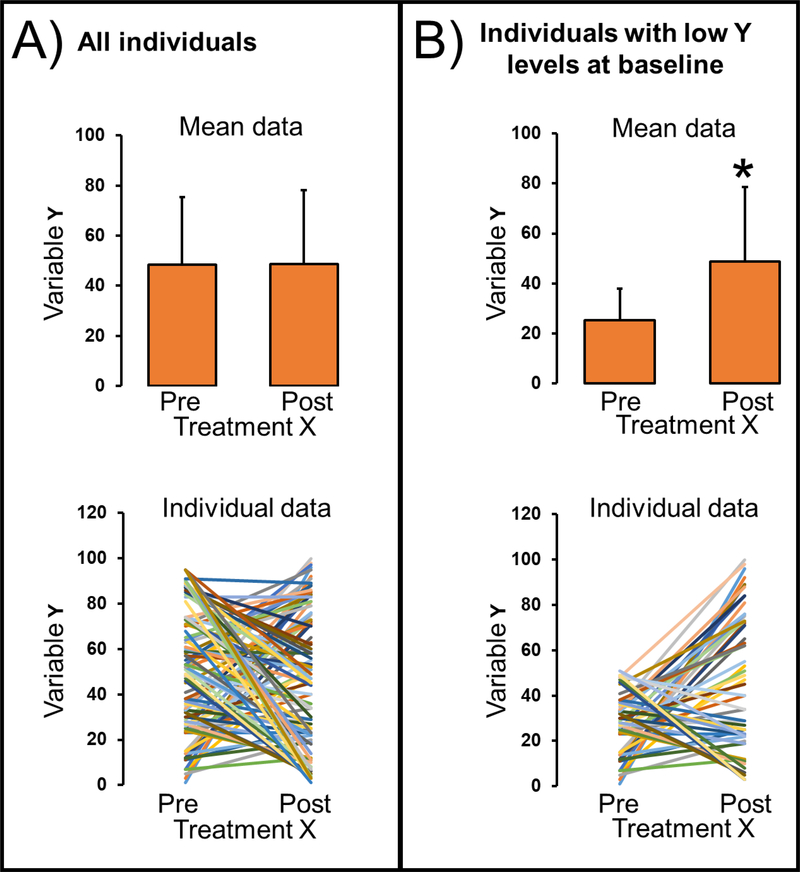
Figure 1. A randomly-generated dataset illustrating a statistically inappropriate secondary analysis that is commonly encountered in the literature.
Panel A includes mean (top) and individual (bottom) data for all individuals (n=100). No significant differences in variable Y in response to treatment X were noted by paired t-test (p=0.92). Panel B includes mean (top) and individual (bottom) data for individuals with lowest Y levels at baseline (n=50). A significant effect of treatment X was noted by paired t-test (p<0.01). Error bars in top sub-panels denote standard deviation. Data were randomly generating using the Excel function [=RANDBETWEEN(0,100)]. The analysis presented in panel B lead to the erroneous conclusion that treatment X increases Y in individuals with low levels of Y at baseline.

