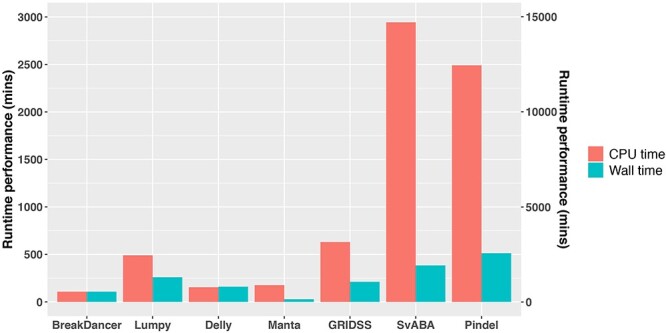
Figure 3.

Runtime performance of SV callers. Results are based on simulation data with tumour and matched-normal coverage of 60× and VAF of 100%. Total CPU time indicates total CPU utilization in parallel-processing mode. Wall time indicates real total elapsed time and can be less than total CPU time if the caller can be efficiently multithreaded. The wall and CPU time of Pindel is labelled on the right vertical axis. Runtime performance was measured in parallel-processing mode using eight cores on a dual socket Xeon E5-2680 V3 server.
