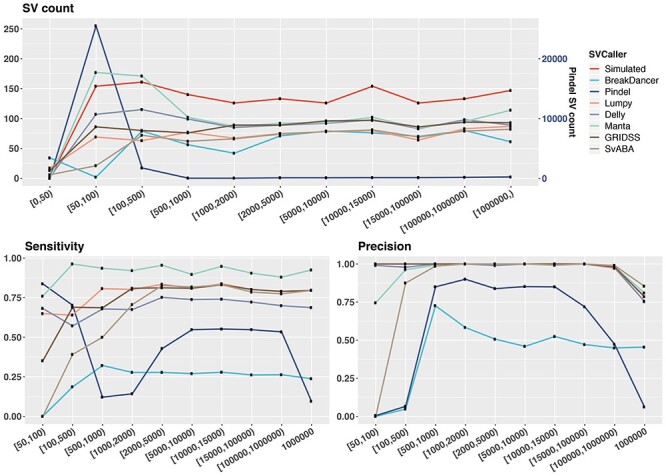
Figure 6.

Performance of SV callers across different variant size ranges. Shown on top is the number of SVs reported by each SV caller within each defined SV size range. The bottom plots show sensitivity (left) and precision (right) evaluated based on a breakpoint precision threshold of 200 bp. Results are based on simulated samples with tumour and matched-normal coverage of 60× and tumour purity of 100%. Size of TRA corresponds to the size of the translocation DNA fragment. The Pindel SV count is on the right vertical axis.
