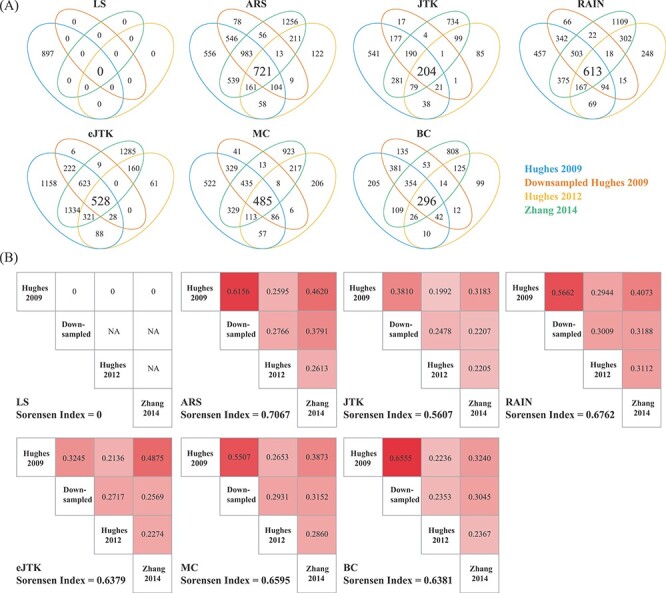
Figure 3.

Evaluation of method reproducibility. (A) Venn diagrams display the number of cyclic genes that are significant by each method among the four dark–dark datasets. (B) Jaccard index and the Sorensen index are used as metrics for reproducibility for each method across the four datasets with the same experimental design.
