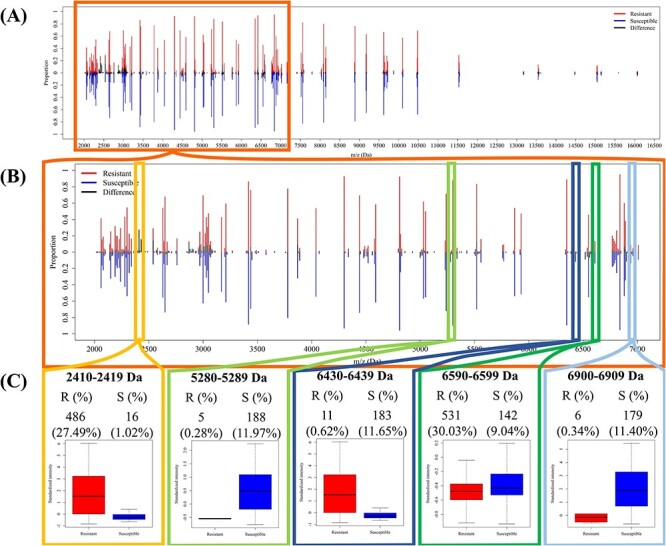
Figure 3.

Comparison of peak distributions between MRSA and MSSA spectra. (A) Distribution of peaks in the region between 2000 and 17 000 Da. (B) Distribution of peaks in the region between 2000 and 7000 Da. (C) The intensity distribution and number (proportion) of spectra with specific peaks.
