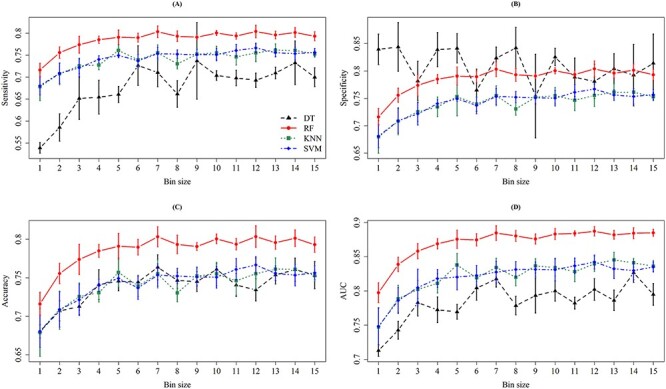
Figure 5.

The means and standard deviations of (A) sensitivity, (B) specificity, (C) accuracy and (D) AUC on five cross-validation for different bin sizes when the intensity is incorporated. In each column of the four subfigures, the means and standard deviations are represented by dots and bars, respectively, for the four ML methods, namely DT (black), RF (red), KNN (green), and SVM (blue).
