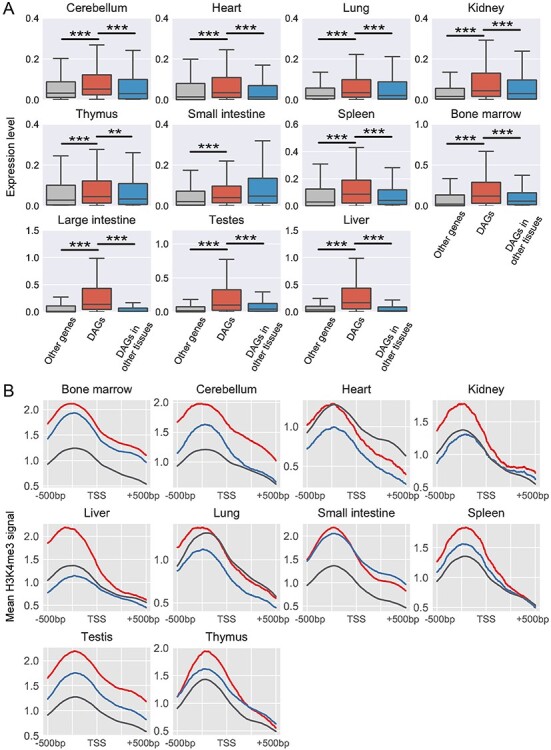
Figure 4.

Transcription and histone modification levels of tissue-specific differential activity genes. (A) Boxplots of transcription levels of differential activity genes (DAGs) and other genes in the single-cell RNA-seq dataset. The middle red box represents the RNA expression level of DAGs in the corresponding tissues. The left gray box represents expressions of other genes. The right blue box represents these DAGs expression in other tissues. Each middle box was compared with both left and right boxes using two-sample Wilcoxon tests. ** and *** indicate 0.001 < P < 0.01 and P < 0.001, respectively. (B) Enrichment analysis of H3K4me3 mark around TSSs of DAGs in ten tissues. The signals around DAGs TSSs and TSSs of remaining genes in the corresponding tissue are labeled with red and gray colors, respectively. The blue line is the mean signal around TSSs of DAGs in other tissues.
