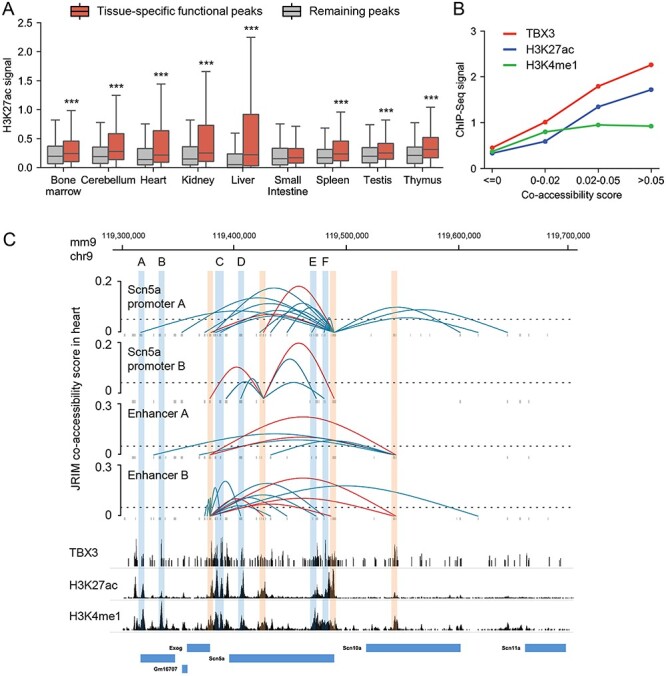
Figure 5.

Illustration of the distinct regulatory mechanisms of Scn5a. (A) Boxplots of the H3K27ac signal of tissue-specific functional peaks compared to those of other peaks. (B) The occupancy profiles of TBX3, H3K4me1 signal and H3K27ac signal of Scn5a promoter-related peaks (co-accessibility score > 0) and other peaks. (C) The reconstructed cis-regulatory interaction network around the Scn10a-Scn5a locus (chr9: 119 300 000–119 700 000) in heart. The regions of Scn5a promoters and enhancer A, B are labeled with red boxes. Blue boxes indicate locations of TBX3 enriched regions A-F. The bottom is ChIP-seq data around Scn5a gene. The image is drawn on basis of WashU epigenome browser with RefSeq gene annotations.
