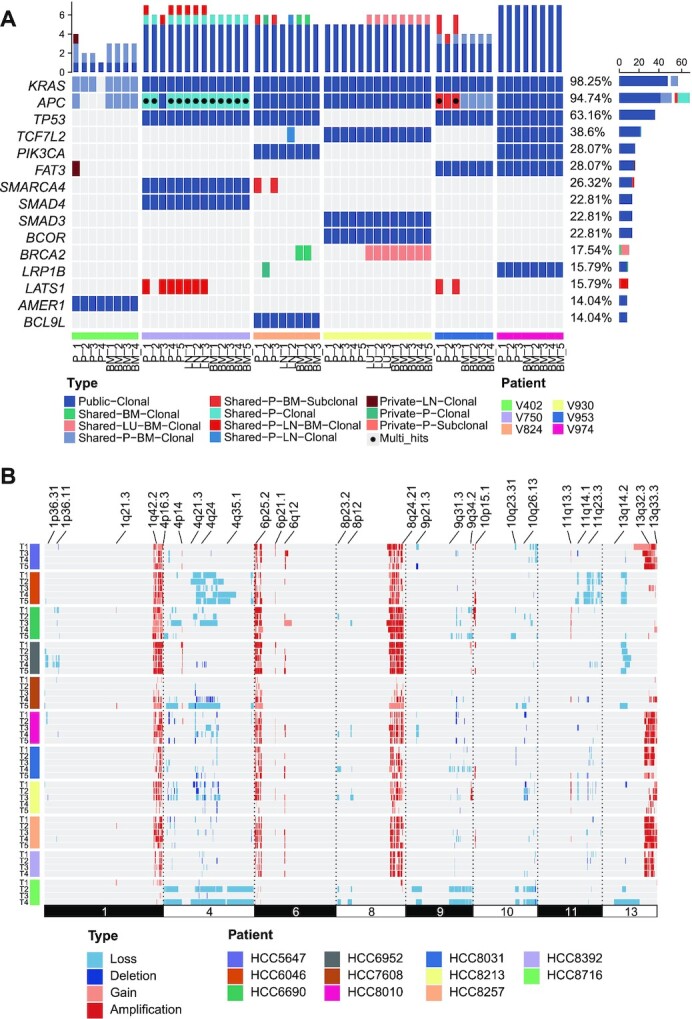
Figure 2:

Mutational landscape of the HCC and CRC cohorts A. Mutational profile of the CRC cohort. The oncoprint of the top 15 most frequently mutated driver genes of CRC grouped by public, shared, or private mutations, including both clonal and subclonal drivers. Genes were sorted by mutational frequency, and those with multiple mutations were annotated as Multi_Hit. Samples were split by patients as indicated by the annotation bar (bottom). BM: brain metastasis; LN: lymph node metastasis; LU: lung metastasis; P: primary tumor. The stacked bar charts on the top and right show the number of different types of mutations per sample and per driver gene, respectively. B. The consistent CNAs of the HCC cohort with significant recurring CNAs were identified from the TCGA hepatocellular carcinoma project by GISTIC2.0 (obtained from the Broad GDAC website). Each track represents 1 tumor sample. Dark red indicates amplifications (CN ≥ 4), light red indicates gains (2 < CN < 4), dark blue indicates deletions (CN = 0), and light blue indicates losses (0 < CN < 2).
