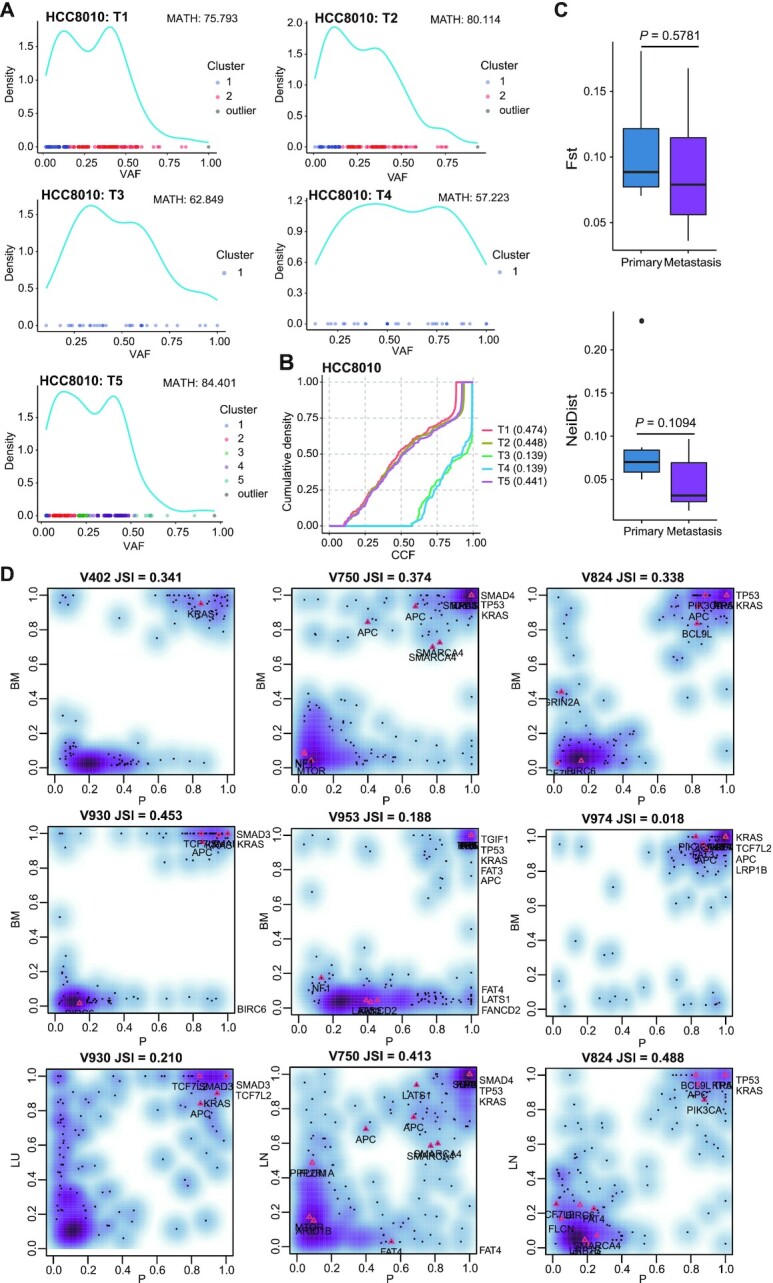
Figure 3:

ITH estimation and the clonality of metastatic seeding A. Clustering mutations by VAFs of each tumor sample from HCC8010 based on a Gaussian finite mixture model. MATH scores are indicated above. B. CCF density plot of tumor samples from HCC8010. C. FST- and Nei distance–based quantification of ITH in paired primary tumors and metastases of the CRC cohort (n = 7). P-value, Wilcoxon rank-sum test (2-sided). D. Density plots of merged CCF values in paired primary tumors and metastases of the CRC cohort. For each pair, the JSI was computed according to equation (7). Putative CRC driver genes are indicated on the plot. BM: brain metastasis; LN: lymph node metastasis; LU: lung metastasis; P: primary tumor.
